

Index
Omar Vizquel
Combining Jamie Moyer's longevity and Andruw Jones's defensive prowess is Omar Vizquel, who has played more games at shortstop, 2709, than any player in Major League history, and is considered to be one of the best defensive shortstops ever. Along with Moyer, Vizquel is one of 29 players to have played in four decades; Vizquel came up in 1989, his age-22 season, and played his last game in 2012, his age-45 season.
How much will the highlight reel help—or hurt—Omar Vizquel? Playing entirely in not just the television era but in the television-saturation era, Vizquel's rabbit-like jumps and bare-handed grabs, which invited comparisons to Ozzie Smith, reinforced Vizquel's wizardry at arguably the hardest defensive position on the diamond, so much so that a parade of commentators glibly declaring that Vizquel is, or should be, a Hall of Famer have made that pronouncement into an article of faith. But does Vizquel's record justify the claim?
The most obvious comparison is to Ozzie Smith, known primarily for his defensive play but who compiled a respectable offensive record, and—encouragingly for Vizquel—who was voted into the Hall of Fame on his first try in 2002 with 91.7 percent of the vote. (Smith was the only candidate elected in 2002, on a ballot that included six candidates elected subsequently.) So, how does Vizquel stack up against Smith?
The table below displays defensive statistics for Smith and Vizquel including games played at shortstop, putouts, assists, double plays turned, fielding percentage, Total Zone runs above average (RAA), range factor per nine innings (RF/9: 9 times (putouts plus assists) divided by innings played), and that range factor for the player's league.
| |
GP |
PO |
A |
DP |
FPct. |
RAA |
RF/9 |
lgRF/9 |
| Smith, Ozzie |
2511 |
4249 |
8375 |
1590 |
.978 |
239 |
5.22 |
4.78 |
| Vizquel, Omar |
2709 |
4102 |
7676 |
1734 |
.985 |
134 |
4.62 |
4.61 |
Defensively, the edge goes to Smith. Although Vizquel was more sure-handed (his .985 fielding percentage is second-best all-time) and turned more double plays (Smith is second only to Vizquel), Smith got to more balls—he is fifth all-time in range factor per nine innings and is the all-time leader in assists—and is clearly ahead in run prevention. Moreover, Ozzie Smith's defensive Wins Above Replacement (dWAR) value of 43.4 is the best of any player in MLB history. Omar Vizquel's dWAR of 28.4 is tied for tenth all-time with another shortstop, Bill Dahlen, while seven other shortstops including Smith are ahead of them on the list, which includes all players regardless of position. (Third baseman Brooks Robinson and catcher Ivan Rodriguez, tied with shortstop Bobby Wallace at eighth place, are the only non-shortstops in the top ten.)
This is not to say that Omar Vizquel's case as a defensive player is not strong, or even compelling, because it is and will be a major factor in deciding his viability for the Hall of Fame. But defensive prowess alone is not an automatic Hall pass. While seven players in that top ten who are eligible for the Hall of Fame are in the Hall, shortstops Mark Belanger, second all-time with a 39.4 dWAR, and Dahlen are not in Cooperstown. Dahlen, whose career occurred a century ago, well before the Hall of Fame existed, has long been a darling of baseball historians whose case has been bolstered by modern advanced metrics. (I made the case for Bill Dahlen in my evaluation of the Pre-Integration Era vote in late 2015.) As for Belanger, who generated a .228/.300/.280/.580 slash line as in 2016 games and 6601 plate appearances he collected 1316 hits, with only 228 of those for extra bases, his offensive WAR (oWAR) of 14.6 and overall bWAR of 41.0 is hardly going to make a case for his Cooperstown inclusion.
How does Vizquel stack up offensively with Smith? The table below displays quantitative offensive statistics for Smith and Vizquel including plate appearances, hits, doubles, triples, bases on balls, stolen bases, sacrifice hits, and runs scored.
| |
PA |
H |
2B |
3B |
BB |
SB |
SH |
R |
| Smith, Ozzie |
10,778 |
2460 |
402 |
69 |
1072 |
580 |
214 |
1257 |
| Vizquel, Omar |
12,013 |
2877 |
456 |
77 |
1028 |
404 |
256 |
1445 |
The table below displays qualitative offensive statistics for Smith and Vizquel including slash line (batting average, on-base percentage, slugging percentage, on-base plus slugging percentage), weighted on-base average, Wins Above Replacement (Baseball Reference version), Wins Above Replacement (FanGraphs version), adjusted OPS, and weighted runs created.
| |
Slash Line |
wOBA |
bWAR |
fWAR |
OPS+ |
wRC+ |
| Smith, Ozzie |
.262/.337/.328/.666 |
.305 |
76.5 |
67.6 |
87 |
90 |
| Vizquel, Omar |
.272/.336/.352/.688 |
.310 |
45.3 |
42.6 |
82 |
83 |
Offensively, both Smith and Vizquel are a wash: Vizquel has marginally higher percentages and marginally lower indexes for OPS+ and wRC+, although since both indexes are calculated based on all hitters in the league, Vizquel's could be lower because of the higher offense of his era, particularly the "Steroids Stretch" of the late 1990s and early 2000s that inflated offensive statistics overall. Smith fell 40 hits shy of the 2500-hit plateau while Vizquel came within 123 hits of the vaunted 3000-hit club.
But if Omar Vizquel has the superlative defensive skills and is on a par with Ozzie Smith offensively, why is Vizquel's value as expressed by WAR dramatically lower than Smith's?
Will Omar Vizquel's defensive wizardry at shortstop be his ticket to Cooperstown? Or are voters looking for more from the durable infielder?
The answer may lie indirectly with the relative quality of the competition at shortstop that each faced, with Vizquel, whose career began 11 years after Smith's, not only having to contend with the superstar shortstops of Smith's tenure, such as Tony Fernandez, Cal Ripken, Jr., Alan Trammell, and Robin Yount, but also the next wave that included Nomar Garciaparra, Derek Jeter, Barry Larkin, Alex Rodriguez, and Miguel Tejada, with Jimmy Rollins, Troy Tulowitzki, and Michael Young joining them a few years later.
The table below contains qualitative offensive statistics of notable shortstops whose careers overlapped those of Omar Vizquel and Michael Young, who are notated below in bold italic. These include players already in the Hall of Fame (noted with a "+"), players still active as of 2017 (noted with a "="), and retired players who are or who soon will be eligible for the Hall of Fame, either on the writers' ballot or on the Divisional Era Committee ballot. This also includes Mark Belanger, whose career predates all of these players but whose defensive statistics provide further comparison.
| Shortstops from Eras of Omar Vizquel and Michael Young, Ranked by bWAR |
||||||
| Player |
Slash Line |
wOBA |
bWAR |
fWAR |
OPS+ |
wRC+ |
| Rodriguez, Alex |
.296/.381/.552 |
.397 |
118.4 |
113.6 |
141 |
141 |
| + Ripken, Jr., Cal |
.276/.340/.447 |
.346 |
95.5 |
92.5 |
112 |
112 |
| + Yount, Robin |
.285/.342/.430 |
.343 |
77.0 |
66.5 |
115 |
113 |
| + Smith, Ozzie |
.262/.337/.328 |
.305 |
76.5 |
67.6 |
87 |
90 |
| Jeter, Derek |
.310/.377/.440 |
.360 |
71.8 |
71.7 |
115 |
119 |
| Trammell, Alan |
.285/.352/.415 |
.343 |
70.4 |
63.7 |
110 |
111 |
| + Larkin, Barry |
.295/.371/.444 |
.360 |
70.2 |
67.0 |
116 |
118 |
| Tejada, Miguel |
.285/.336/.456 |
.341 |
46.9 |
39.7 |
108 |
106 |
| Rollins, Jimmy |
.264/.324/.418 |
.323 |
46.0 |
49.1 |
95 |
95 |
| Vizquel, Omar |
.272/.336/.352 |
.310 |
45.3 |
42.6 |
82 |
83 |
| Fernandez, Tony |
.288/.347/.399 |
.333 |
45.0 |
43.5 |
101 |
102 |
| Garciaparra, Nomar |
.313/.361/.521 |
.376 |
44.2 |
41.4 |
124 |
124 |
| = Tulowitzki, Troy |
.293/.366/.504 |
.374 |
41.2 |
36.0 |
120 |
121 |
| Belanger, Mark |
.228/.300/.280 |
.272 |
41.0 |
34.9 |
68 |
71 |
| Young, Michael |
.300/.346/.441 |
.342 |
24.2 |
23.8 |
104 |
104 |
+ Indicates a Hall of Fame member.
= Indicates a player still active as of the 2017 season.
The table below lists those shortstops, ranked by JAWS, along with other JAWS statistics and ratings for the Hall of Fame Monitor and the Hall of Fame Standards. Also included are the aggregate JAWS statistics for all shortstops in the Hall of Fame.
| Shortstops from Eras of Omar Vizquel and Michael Young, Ranked by JAWS |
|||||||||
| Player |
No. of Years |
From |
To |
bWAR |
WAR7 |
JAWS |
JAWS Rank |
HoF Mon. (≈100) |
HoF Std. (≈50) |
| Rodriguez, Alex |
22 |
1994 |
2016 |
118.4 |
64.2 |
91.3 |
2 |
390 |
78 |
| + Ripken, Jr., Cal |
21 |
1981 |
2001 |
95.5 |
56.1 |
75.8 |
3 |
236 |
58 |
| + Yount, Robin |
20 |
1974 |
1993 |
77.0 |
47.2 |
62.1 |
5 |
132 |
52 |
| + Smith, Ozzie |
19 |
1978 |
1996 |
76.5 |
42.3 |
59.4 |
8 |
142 |
35 |
| Trammell, Alan |
20 |
1977 |
1996 |
70.4 |
44.6 |
57.5 |
11 |
118 |
40 |
| Jeter, Derek |
20 |
1995 |
2014 |
71.8 |
42.2 |
57.0 |
12 |
337 |
67 |
| + Larkin, Barry |
19 |
1986 |
2004 |
70.2 |
43.1 |
56.6 |
13 |
120 |
47 |
| Ave. of 21 SS HoFers |
NA |
NA |
NA |
66.7 |
42.0 |
54.8 |
NA |
NA |
NA |
| Garciaparra, Nomar |
14 |
1996 |
2009 |
44.2 |
43.0 |
43.6 |
23 |
112 |
41 |
| Tejada, Miguel |
16 |
1997 |
2013 |
46.9 |
36.5 |
41.7 |
27 |
148 |
44 |
| = Tulowitzki, Troy |
11 |
2006 |
2016 |
41.2 |
39.6 |
40.4 |
29 |
46 |
36 |
| Rollins, Jimmy |
17 |
2000 |
2016 |
46.0 |
32.4 |
39.2 |
32 |
121 |
42 |
| Fernandez, Tony |
17 |
1983 |
2001 |
45.0 |
30.3 |
37.7 |
34 |
75 |
32 |
| Belanger, Mark |
18 |
1965 |
1982 |
41.0 |
32.0 |
36.5 |
38 |
59 |
16 |
| Vizquel, Omar |
24 |
1989 |
2012 |
45.3 |
26.6 |
36.0 |
41 |
120 |
42 |
| Young, Michael |
14 |
2000 |
2013 |
24.2 |
21.1 |
22.6 |
93 |
112 |
36 |
+ Indicates a Hall of Fame member.
= Indicates a player still active as of the 2017 season.
WAR tends to favor offensive production, as do Hall of Fame voters, with Ozzie Smith being a notable exception. Of the seven shortstops in the table immediately above whose JAWS score is higher than the aggregate JAWS score of all Hall of Fame shortstops, four are in the Hall already: Robin Yount, Cal Ripken, Jr., Barry Larkin, and Ozzie Smith.
Neither Alex Rodriguez nor Derek Jeter is yet eligible for the Hall of Fame although their times are approaching—and with markedly different expectations. Rodriguez, who incurred the longest PED suspension in MLB history, is sure to re-ignite the PED debate even if the stigma may be lifting. Jeter, on the other hand, could conceivably beat Ken Griffey, Jr.'s, historic vote count to become the first unanimous election in Hall of Fame history.
This leaves, among the seven shortstops in our sample of those above the JAWS aggregate score, Alan Trammell, whose 15th and final year on a Hall of Fame ballot was in 2016, and who despite a last-chance surge—his 40.9 percent of the vote was the best of his tenure on the ballot—fell far short of the minimum needed for election. Trammell, a sabermetric darling, toiled in relative obscurity for the Detroit Tigers despite four Gold Gloves, six All-Star selections, and the 1984 World Series Most Valuable Player award to his credit.
Alan Trammell was worth more than 70 wins above a replacement player, offensively and defensively, yet still couldn't gain election to the Hall of Fame. Omar Vizquel was worth just over 45 wins—does he even stand a chance?
Again, WAR is not the final arbiter of Hall of Fame worthiness; other factors contribute to the player's qualifications—real or perceived—for the Hall. As noted, Vizquel is considered to be one of the greatest defensive shortstops of all time as both advanced defensive metrics and the good old "eye test"—magnified by the truckload of highlight-reel plays he made captured on video—have demonstrated. Could that be the factor to nudge Vizquel's modest overall WAR score into the Hall of Fame?
The following table ranks the shortstops profiled previously by dWAR, their defensive Runs Above Replacement, with representative qualitative and quantitative career statistics listed as well. The two shortstops profiled in this article, Omar Vizquel and Michael Young, are listed in bold italic.
| Shortstops from Eras of Omar Vizquel and Michael Young, Ranked by dWAR |
|||||||||
| Player |
Games |
Putouts |
Assists |
Double Plays Turned |
Total Zone |
dWAR |
Fld. Pct. |
RF/9 |
League RF/9 |
| + Smith, Ozzie |
2511 |
4249 |
8375 |
1590 |
239 |
43.4 |
.978 |
5.22 |
4.78 |
| Belanger, Mark |
1942 |
3005 |
5786 |
1054 |
238 |
39.4 |
.977 |
5.16 |
4.93 |
| + Ripken, Jr., Cal |
2302 |
3651 |
6977 |
1565 |
176 |
34.6 |
.979 |
4.73 |
4.69 |
| Vizquel, Omar |
2709 |
4102 |
7676 |
1734 |
134 |
28.4 |
.985 |
4.62 |
4.61 |
| Trammell, Alan |
2139 |
3391 |
6172 |
1307 |
81 |
22.0 |
.977 |
4.71 |
4.77 |
| = Tulowitzki, Troy |
1124 |
1781 |
3493 |
791 |
110 |
14.8 |
.985 |
4.90 |
4.37 |
| Fernandez, Tony |
1573 |
2708 |
4511 |
943 |
42 |
14.2 |
.980 |
4.83 |
4.66 |
| + Larkin, Barry |
2085 |
3150 |
5858 |
1092 |
28 |
13.8 |
.975 |
4.62 |
4.57 |
| = Rollins, Jimmy |
2227 |
2982 |
6139 |
1249 |
44 |
13.6 |
.983 |
4.21 |
4.42 |
| Rodriguez, Alex |
1272 |
2014 |
3605 |
853 |
18 |
9.6 |
.977 |
4.62 |
4.62 |
| Garciaparra, Nomar |
1055 |
1606 |
2955 |
581 |
34 |
6.0 |
.968 |
4.48 |
4.61 |
| Tejada, Miguel |
1946 |
2891 |
5804 |
1274 |
–56 |
5.9 |
.972 |
4.62 |
4.54 |
| + Yount, Robin |
1479 |
2588 |
4794 |
941 |
25 |
5.8 |
.964 |
4.99 |
4.90 |
| Jeter, Derek |
2674 |
3820 |
6605 |
1408 |
–182 |
–9.7 |
.976 |
4.04 |
4.51 |
| Young, Michael |
793 |
1121 |
2278 |
530 |
–48 |
–11.5 |
.977 |
4.52 |
4.50 |
+ Indicates a Hall of Fame member.
= Indicates a player still active as of 2016
The table below displays the quantitative offensive statistics for Trammell and Vizquel including plate appearances, hits, doubles, triples, bases on balls, stolen bases, sacrifice hits, and runs scored.
| |
PA |
H |
2B |
3B |
BB |
SB |
SH |
R |
| Trammell, Alan |
9376 |
2365 |
412 |
55 |
850 |
236 |
124 |
1231 |
| Vizquel, Omar |
12,013 |
2877 |
456 |
77 |
1028 |
404 |
256 |
1445 |
In addition, Trammell hit 185 home runs to Vizquel's 80 while Trammell drove in 1003 runs and Vizquel drove in 951, a much closer comparison although Vizquel had roughly a quarter more plate appearances than did Trammell.
The table below displays qualitative offensive statistics for Trammell and Vizquel including slash line (batting average, on-base percentage, slugging percentage, on-base plus slugging percentage), weighted on-base average, Wins Above Replacement (Baseball Reference version), Wins Above Replacement (FanGraphs version), adjusted OPS, and weighted runs created.
| |
Slash Line |
wOBA |
bWAR |
fWAR |
OPS+ |
wRC+ |
| Trammell, Alan |
.285/.352/.415/.767 |
.343 |
70.4 |
63.7 |
110 |
111 |
| Vizquel, Omar |
.272/.336/.352/.688 |
.310 |
45.3 |
42.6 |
82 |
83 |
Trammell is clearly the more effective offensive player qualitatively, and while Vizquel posted the larger quantitative totals, he also had over 2600 more plate appearances than did Trammell. But compared to Trammell's, can Vizquel's defensive statistics give him the edge that could land him in the Hall of Fame?
The table below isolates for Trammell and Vizquel defensive statistics cited in the comprehensive table above including games played at shortstop, putouts, assists, double plays turned, fielding percentage, Total Zone runs above average (RAA), range factor per nine innings (RF/9: 9 times (putouts plus assists) divided by innings played), and that range factor for the player's league.
| |
GP |
PO |
A |
DP |
FPct. |
RAA |
RF/9 |
lgRF/9 |
| Trammell, Alan |
2139 |
3391 |
6172 |
1307 |
.977 |
81 |
4.71 |
4.77 |
| Vizquel, Omar |
2709 |
4102 |
7676 |
1734 |
.985 |
134 |
4.62 |
4.61 |
In defensive WAR, Vizquel ranks tenth with 28.4 while Trammell is no slouch, ranking 34th with 22.0.
Trammell won four Gold Gloves and was the MVP runner-up in the American League in 1987, six percentage points behind George Bell in the voting, and in today's analytical environment he might have been the winner with an 8.2 bWAR compared to Bell's 5.0. Trammell was also named to six All-Star Games. Moreover, Trammell won a World Series ring with the Detroit Tigers in 1984 when they defeated the San Diego Padres in five games, with Trammell named as the Series MVP as he unleashed a blistering .450/.500/.800/1.300 slash line with two home runs and six RBI; Trammell also hit a scorching .364/.500/.818/1.318 against the Kansas City Royals as the Tigers swept them in three games during the AL Championship Series.
Yet Alan Trammell, despite lasting on a Hall of Fame ballot for all 15 years of his eligibility, languished all during that time, with the first ten years seeing him fail to secure even one-quarter of the vote. His fortunes improved marginally in the last five years, surging to 40.9 percent in his final year in 2016, but despite ranking in the top 100 all-time in bWAR—his 70.4 is 93rd—Trammell failed to generate the perception that he is a Hall of Famer.
Vizquel won 11 Gold Gloves, nine of them consecutively from 1993 to 2001, although his only showing in MVP voting was a 16th-place finish in 1999 when, with the Cleveland Indians, he knocked out 191 hits for a .333 batting average and a 111 OPS+ while scoring 112 runs, all career highs, as he stole 42 bases in 51 attempts. As part of the powerhouse Indians teams of the 1990s, Vizquel went to the postseason every year from 1995 to 1999, including two trips to the World Series, where the Indians lost to the Atlanta Braves in six games in 1995, and to the then-Florida Marlins in seven games in 1997. In 57 postseason games, Vizquel posted a .250/.327/.316/.643 slash line as he averaged one hit per game with four triples overall as he stole 23 bases while getting caught just three times, stealing five bases against the Marlins in the 1997 World Series without getting thrown out once.
As he enters Hall of Fame ballot voting, Omar Vizquel may enjoy one advantage not afforded to Trammell: Although Vizquel may have been overshadowed by the spate of "super shortstops" from Cal Ripken, Jr., to Derek Jeter, Alex Rodriguez, Troy Tulowitzki and even Miguel Tejada, all of whom were lauded for their offensive prowess, Vizquel was generally regarded as the premier defensive shortstop among them, at least in the American League, where Vizquel played for 20 of his 24 years in the Major Leagues. And with the current appreciation for run prevention, helped by the advances in defensive metrics and analysis, that quality may prove beneficial to Vizquel's chances.
Ironically, though, Vizquel's most encouraging sign of Hall of Fame enshrinement may not lie in current or future trends but in the past: Voted into the Hall of Fame by the BBWAA in 1954, Walter "Rabbit" Maranville seems to be an unlikely candidate for enshrinement, but a comparison of his record against Vizquel's may raise an eyebrow even if Maranville, whose career straddled the Dead Ball and Live Ball Eras, played decades before Vizquel did.
Vizquel played for 24 seasons; Maranville, whose career began in 1912 and ended in 1935, played for 23 seasons—he did not play in 1934, his age-42 season, and played in just 23 games in 1935. Like Vizquel, Maranville was a shortstop for much of career, although he did play more than 500 games at second base while Vizquel's longest tenure away from short was 150 games at third base.
As we've done for Ozzie Smith and Alan Trammell, the following tables compare Maranville's defensive and offensive records with Vizquel's. The table below displays their defensive statistics including games played at shortstop, putouts, assists, double plays turned, fielding percentage, Total Zone runs above average (RAA), range factor per nine innings (RF/9: 9 times (putouts plus assists) divided by innings played), and that range factor for the player's league, noting that RAA totals for Maranville are not available.
| |
GP |
PO |
A |
DP |
FPct. |
RAA |
RF/9 |
lgRF/9 |
| Maranville, Rabbit |
2153 |
5139 |
7354 |
1188 |
.952 |
NA |
5.92 |
5.64 |
| Vizquel, Omar |
2709 |
4102 |
7676 |
1734 |
.985 |
134 |
4.62 |
4.61 |
Among shortstops, Maranville is the lifetime leader in putouts (Smith is 8th, Vizquel 11th, Trammell 28th), he ranks 5th in assists (Smith is tops, Vizquel 3rd, Trammell 17th), and 18th in double plays turned (Vizquel is tops, followed by Smith, with Trammell 7th). Furthermore, Maranville ranks 7th in defensive WAR with 30.8, behind lifetime leader Smith and ahead of Vizquel (10th) and Trammell (34th).
Offensively, Maranville and Vizquel have many similarities. The table below displays their quantitative offensive statistics including plate appearances, hits, doubles, triples, bases on balls, stolen bases, sacrifice hits, and runs scored.
| |
PA |
H |
2B |
3B |
BB |
SB |
SH |
R |
| Maranville, Rabbit |
11,254 |
2605 |
380 |
177 |
839 |
291 |
300 |
1256 |
| Vizquel, Omar |
12,013 |
2877 |
456 |
77 |
1028 |
404 |
256 |
1445 |
The table below displays their qualitative offensive statistics including slash line (batting average, on-base percentage, slugging percentage, on-base plus slugging percentage), weighted on-base average, Wins Above Replacement (Baseball Reference version), Wins Above Replacement (FanGraphs version), adjusted OPS, and weighted runs created.
| |
Slash Line |
wOBA |
bWAR |
fWAR |
OPS+ |
wRC+ |
| Maranville, Rabbit |
.258/.318/.340/.658 |
.313 |
42.8 |
42.5 |
82 |
83 |
| Vizquel, Omar |
.272/.336/.352/.688 |
.310 |
45.3 |
42.6 |
82 |
83 |
Offensively and defensively, Omar Vizquel looks like the Rabbit Maranville of his era. Is that a positive assessment? Maranville was voted into the Hall of Fame; it was on his 14th try, with 82.9 percent of the vote; sadly, Maranville had died at age 62 in January 1954, just months before the induction ceremony. By contrast, Ozzie Smith was elected on his first ballot, and appears to be able to execute his vaunted backflips even today.
Omar Vizquel's fate falls between those two Hall of Fame shortstops. He is not likely to be elected on his first ballot, a combination of the ballot logjam (which does appear to be easing from what it had been a few years ago) and of needing to build the groundswell of support among the voters, but he seems likely to make it in after a few tries.
This is appropriate for one of the top defenders all-time at arguably the toughest defensive position on the diamond. Over the course of his lengthy career, Omar Vizquel supplied respectable, if not spectacular, offense while providing a lifetime's worth of highlight-reel plays in the field. In an era of high talent compression and especially of superstar shortstops who have erased the perception of the position needing to be an offensive liability (cf. Mark Belanger's era), that might be enough to get Omar Vizquel into the Hall of Fame—where he belongs.
Scott Rolen
The last candidate in our examination of 2018 candidates, Scott Rolen, seems to have all the perquisites for the Hall of Fame—except for the fame part. That perception could hurt Rolen's chances, as we have seen with Alan Trammell and even with Tim Raines, whose case had to build for a decade before he crossed the threshold just as time was expiring. But does Rolen really have a Hall of Fame case?
Starting his career in 1996 with the Philadelphia Phillies, Rolen toiled for a franchise that was struggling for success—during Rolen's stint with the club, the Phillies finished with a winning record only once, in 2001. The following year, amidst claims that the team wasn't trying hard enough to build a winner, Rolen demanded a trade, so the Phillies dealt him mid-season to the St. Louis Cardinals.
The Cardinals were certainly winners, making the postseason three times during Rolen's tenure including two trips to the World Series in 2004 and 2006, winning it all in that latter trip. And while Rolen was certainly an integral component in St. Louis's success, he was also competing for the limelight against Cardinals stars Chris Carpenter, Jim Edmonds, and especially Albert Pujols. Traded to the Toronto Blue Jays in 2008, Rolen was then dealt to the Cincinnati Reds in the middle of the following year, helping them to reach the postseason in 2010 and 2012, his last year as an active player.
A third baseman for his entire 17-year career, Scott Rolen appeared in 37 games for the Phillies in 1996 before becoming the starting third baseman the following season, which saw him named the National League Rookie of the Year, the first Phillie to earn that honor since Dick Allen in 1964, while Rolen aced out contenders Vladimir Guerrero, profiled in Part 1 of this series and whose auspicious debut on the 2017 Hall of Fame ballot, garnering 71.7 percent of the vote, seems to indicate an induction soon, and Andruw Jones, profiled above and soon to make his inaugural ballot debut with Rolen.
Rolen certainly deserved the award: Posting a .283/.377/.469/.846 slash line, generating a 121 OPS+ and 121 wRC+, the slugging third baseman hit 35 doubles and 21 home runs while scoring 93 runs and driving in 92. Combined with his solid if not yet sterling defensive play, Rolen established a 4.5 bWAR (4.2 by FanGraphs' calculation), a near-All-Star showing, and in fact Rolen would go on to be selected for seven All-Star squads including four consecutive times with the Cardinals from 2003 to 2006.
Despite injuries that dogged him in the latter half of the 2000s, Rolen was a remarkably consistent and productive hitter for almost his entire career. From 1997 to 2010, he produced a slash line of .284/.370/.500/.870 for an OPS+ of 125, averaging 34 doubles, 21 home runs, 82 runs scored, 85 RBI, and 4.9 wins for both bWAR and fWAR every season over that 14-year span. Rolen was a fixture in the heart of the batting order, most frequently hitting clean-up (888 games started and 3796 plate appearances, from which he hit 147 home runs and knocked in 583 runs) while also batting third (397 games started, 1752 plate appearances, 71 home runs, 253 RBI) and fifth (425 GS, 1775 PA, 60 HR, 290 RBI).
From the third, fourth, or fifth spots, Rolen delivered the bulk of his production. The table below details the key statistics of plate appearances, hits, doubles, home runs, runs scored, runs batted in, total bases, and sacrifice flies from each of the middle-of-the-order positions, the total of those three, and Rolen's overall statistics in these categories.
| Batting Order |
PA |
H |
2B |
HR |
R |
RBI |
TB |
SF |
| Third |
1752 |
425 |
102 |
71 |
249 |
253 |
758 |
18 |
| Fourth |
3796 |
918 |
237 |
147 |
567 |
583 |
1632 |
46 |
| Fifth |
1775 |
445 |
105 |
60 |
255 |
290 |
758 |
21 |
| Total 3-4-5 |
7323 |
1788 |
444 |
278 |
1071 |
1126 |
3148 |
85 |
| Career |
8518 |
2077 |
517 |
316 |
1211 |
1287 |
3628 |
93 |
Rolen joins George Brett and Chipper Jones as one of only three third basemen in history to amass at least 2000 hits, 500 doubles, 300 home runs, and 1200 runs batted in; Brett was a first-ballot Hall of Famer, and Jones, on the same 2018 ballot as Rolen, is all but certain to be. Rolen ranks 51st all-time in doubles (517), 54th in sacrifice flies (93),120th in runs batted in (1287), 122nd in home runs (316), 146th in total bases (3628), 174th in runs scored (1211), and 241st in hits (2077).
During his career, Rolen never led the League in any offensive category ("black ink"), which makes it harder to position him as a Hall of Fame candidate, although he had a few top-ten finishes ("gray ink") for the major counting-numbers categories: doubles three times and twice each for runs scored, runs batted in, and extra-base hits, while he finished second in doubles in 2003 to teammate Albert Pujols, and second to the Colorado Rockies' Vinny Castilla in RBI in 2004. He fared better in rate stats as he finished in the top ten four times each for bWAR among position players and for dWAR, leading the National League in that category in 2004, and he finished three times in the top ten for bWAR overall.
But as a defender, Scott Rolen emerges as one of the best third basemen in Major League history. He won eight Gold Gloves, behind only Hall of Famers Brooks Robinson (16 Gold Gloves) and Mike Schmidt (10) among third basemen. At third base, Rolen led the League twice each in putouts, finishing in the top ten six times, and in assists, with eight top-ten finishes including three second-place finishes. He was also among the top ten, including two runner-up finishes, in double plays turned at his position while ranking among the top ten in fielding percentage nine times. In the advanced statistics, Rolen led the League in range factor per game three times and twice each in range factor per nine innings and Total Zone runs above average while ranking in the top ten of all three categories ten times.
For his career, Scott Rolen's rankings among third basemen are fourth all-time in range factor per game (2.63), fifth in Total Zone runs above average (150; although the statistic is applicable only from 1953 on), 11th in assists (4081), 12th in games played at third base (2023) and in double plays turned (355), 20th in fielding percentage (.968), 32nd in range factor per nine innings (2.86), and 47th in dWAR (20.6).
Not surprisingly, based on his offensive and defensive prowess, Scott Rolen ranks tenth all-time among third basemen in Jay Jaffe's Jaffe's War Score System (JAWS), and the only two third basemen who rank higher than he does and are not in the Hall of Fame are Adrian Beltre, who is still an active player, and Chipper Jones. Jones debuts on the same 2018 ballot as does Rolen, and if Hall voters are going to choose only one third baseman on that ballot, the smart money is on Jones, who was the National League's Most Valuable Player in 1999, and who finished in the top ten of MVP voting in five other years. Rolen finished in the top ten of MVP voting only once, in 2004, when he placed fourth behind teammate Pujols, Beltre, and Barry Bonds, who won the award for the seventh and final time.
Although Rolen was named to seven All-Star teams, he spent his career in the shadow of more prominent players even though Rolen was consistently excellent both at the plate and in the field. In an era of high talent compression, in which so many outstanding players tend to level the playing field and make it harder to discern greatness, there also needs to be a perception of greatness cast upon players by the fans, the media, other players—and even by themselves through various forms of self-promotion. Rolen was a "Larry Lunchpail" kind of player who showed up, did his job, and did it well while others tended to get the spotlight.
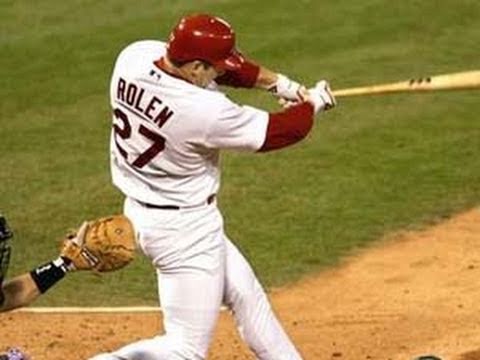
Scott Rolen got it done at the plate and at the hot corner--but do Hall voters appreciate his consistency and excellence?
Adding to Rolen's challenges is the Hall's stinginess when it comes to electing third basemen. Of the nine traditional positions, third basemen have the least representation among Major League Baseball players in the Hall (that is, excluding in this count Negro League players inducted) as only 14 have been inducted. To be fair, catchers have endured a similar fate, and it is only the back-to-back elections of Mike Piazza in 2016 and Ivan Rodriguez in 2017 that has pushed catchers ahead by one, to 15.
But since the BBWAA began voting for players to enter the Hall in 1936, writers have elected only seven third basemen (they have elected ten catchers), with the first, Pie Traynor, coming in 1938—and with another 30 years elapsing before the writers voted in Eddie Mathews. True, the BBWAA got on a roll starting in 1995, electing four third basemen in a ten-year stretch (in chronological order: Mike Schmidt, George Brett, Paul Molitor, and Wade Boggs). And the now-defunct Golden Era Committee in 2012 redressed a major grievance by electing Ron Santo, long considered one the Hall's major snubs, while its fellow (and also now-defunct) Pre-Integration Era Committee provided the only player induction the following year by electing Deacon White, who had been both a catcher and a third baseman during his career, and who had been born nearly 14 years before the Civil War—that's the American Civil War—began.
The good news for Rolen is that BBWAA voters, thanks to the 2016 pruning of the voting roll of members who had not written about baseball for at least 10 years, are becoming progressively savvier about analytics—and, significantly, are backing away from the moral dudgeon of previous voters publicly opposed to any candidate with even a suspicion of having used performance-enhancing drugs. (Please note that the PED issue has never been associated with Scott Rolen.)
With Chipper Jones on the 2018 ballot, Scott Rolen might not be elected his first time out—although the writers could score a coup by electing two third basemen in the same year—but he will be elected in a succeeding year. Rolen was a consistent, solid, reliable power hitter and run-producer as well as being one of the top defensive third basemen of his era—or any era. His greatest weakness is his relative anonymity, which should not obscure his ample qualifications for the Baseball Hall of Fame. Fortunately for him, the voters know that too.

Comments powered by CComment