

Index
Pitcher: Tommy John, Jack Morris, Luis Tiant
No question about it, the three pitchers on the Modern Baseball ballot form one hell of a bubble—all three have inspired heated debate practically since they became eligible for the Hall of Fame.Tommy John's name has been ubiquitous in baseball thanks to Doctor Frank Jobe's surgical graft procedure, ulnar collateral ligament reconstruction, now universally known by the less unwieldy term "Tommy John surgery" as John was the first baseball player to undergo the procedure in 1974, which cost him a season in rehabilitation—but prolonged a career that would have been cut short by his damaged left arm; John pitched until 1989, his age-46 season.
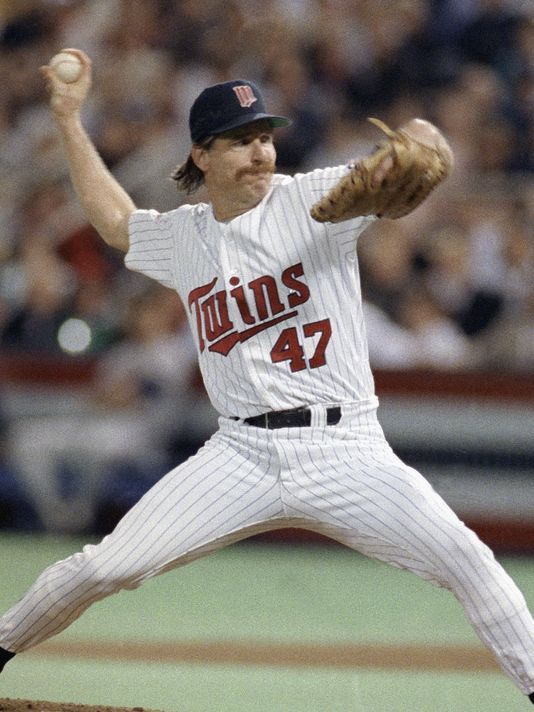
Jack Morris earned a reputation as a battler, similar to Gus Wynn, who "pitched to the score" and cared only about ensuring that his teams won the game. Morris rolled up 254 wins against only 186 losses for an impressive .577 win-loss percentage as he helped lead three different teams to World Series championships, the Detroit Tigers, Minnesota Twins, and Toronto Blue Jays. It was in the 1991 World Series, in which Morris's Twins beat the Atlanta Braves in seven games, that Morris, pitching Game Seven against future Hall of Famer John Smoltz, emerged victorious in one of the great Game Sevens in baseball history.
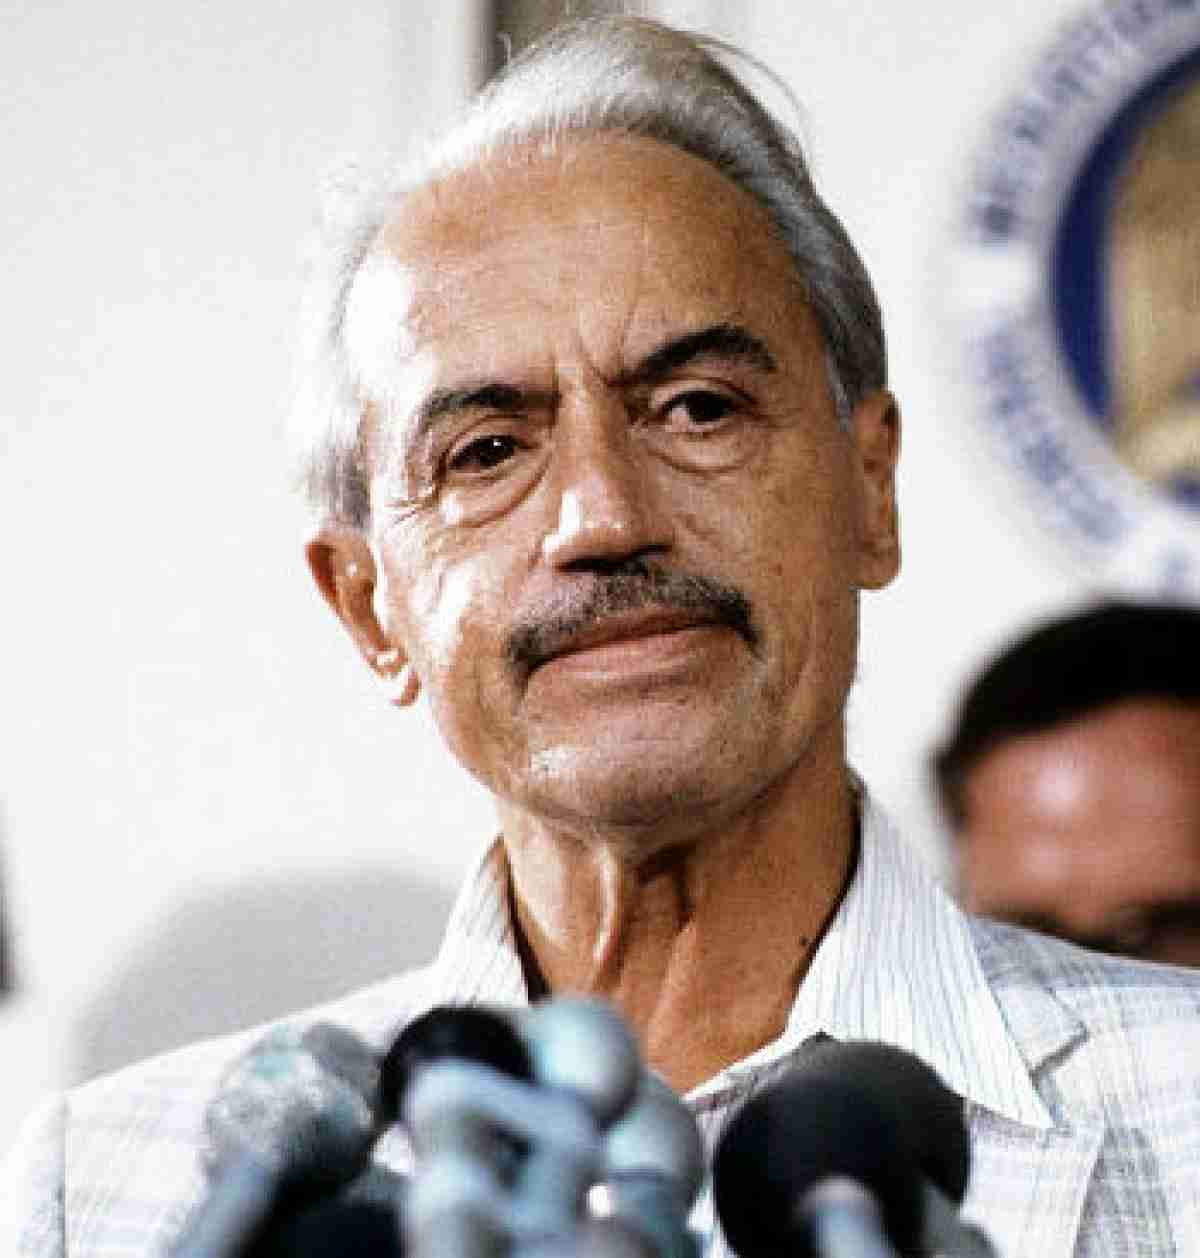
And while Luis Tiant appeared in just one World Series, with the Boston Red Sox in 1975 as they battled the Cincinnati Reds, it too was one of the classic Fall Classics of all time, capped by Carlton Fisk's iconic home run in the bottom of the 12th inning of Game Six that enabled the Red Sox to take the Series to the limit, with Tiant winning two of the three games for Boston including a five-hit Game One shutout.
Tommy John and Luis Tiant
Both Tommy John and Luis Tiant were contemporaries—in fact, Tiant's first season, in 1964, was just one year after John debuted—and so they are discussed immediately below while Jack Morris, whose rookie year was 1977, is discussed below them.
The table below details the Hall of Fame statistics for Tommy John and Luis Tiant and their starting pitcher contemporaries, defined as those who played a significant amount of their careers between 1963 and 1989, the span of both John's career (1963 to 1989) and Tiant's career (1964 to 1982). Aggregate JAWS statistics are marked in bold; John's and Tiant's statistics are marked in bold italic.
| Hall of Fame Statistics for Tommy John and Luis Tiant and Their Starting Pitcher Contemporaries, Ranked by JAWS |
|||||||||
| Player |
fWAR |
bWAR |
WAR7 |
JAWS |
JAWS Rank |
HoF Mon. (≈100) |
HoF Std. (≈50) |
ERA+ |
ERA– |
| + Seaver, Tom |
92.4 |
110.5 |
59.5 |
85.0 |
6 |
244 |
66 |
127 |
79 |
| + Gibson, Bob |
82.3 |
89.9 |
61.6 |
75.8 |
14 |
222 |
54 |
127 |
78 |
| + Niekro, Phil |
78.1 |
96.6 |
54.5 |
75.6 |
15 |
157 |
52 |
115 |
86 |
| + Blyleven, Bert |
102.9 |
95.3 |
50.7 |
73.0 |
16 |
120 |
50 |
118 |
85 |
| + Carlton, Steve |
96.5 |
90.4 |
54.3 |
72.4 |
17 |
266 |
58 |
115 |
87 |
| + Perry, Gaylord |
100.1 |
91.0 |
52.8 |
71.9 |
20 |
177 |
57 |
117 |
85 |
| + Jenkins, Ferguson |
80.1 |
84.9 |
51.8 |
68.3 |
24 |
132 |
53 |
115 |
87 |
| + Ryan, Nolan |
106.7 |
81.8 |
43.3 |
62.6 |
31 |
256 |
56 |
112 |
90 |
| ALL HoF PITCHERS |
NA |
73.9 |
50.3 |
62.1 |
NA |
NA |
NA |
NA |
NA |
| + Palmer, Jim |
56.6 |
69.4 |
48.0 |
58.7 |
37 |
192 |
56 |
125 |
79 |
| + Marichal, Juan |
61.2 |
63.1 |
51.9 |
57.5 |
43 |
159 |
57 |
123 |
81 |
| Tiant, Luis |
54.8 |
66.7 |
44.6 |
55.6 |
51 |
97 |
41 |
114 |
87 |
| + Sutton, Don |
85.5 |
67.4 |
34.0 |
50.7 |
71 |
149 |
58 |
108 |
92 |
| John, Tommy |
79.4 |
62.0 |
34.7 |
48.4 |
83 |
112 |
44 |
111 |
90 |
| Wood, Wilbur |
36.9 |
50.2 |
45.8 |
48.0 |
86 |
63 |
21 |
114 |
88 |
Based on the table above, it is not surprising that both John and Tiant have faced a tough time getting Hall of Fame recognition—of the 12 pitchers used in the comparison with John and Tiant, only Wilbur Wood, the knuckleballing southpaw who found success as both a starter and reliever while toiling primarily for the Chicago White Sox, is not in the Hall of Fame.
Moreover, both John and Tiant fall below the JAWS thresholds established by the aggregate numbers of all starting pitchers currently in the Hall of Fame, Tiant by 6.5 wins and John by 13.7 wins, although FanGraphs has significant differences in WAR compared to Baseball Reference, upon which Jay Jaffe's JAWS model is based: Tiant loses nearly 12 wins while John gains 17.4 wins, which puts John in the range of Bob Gibson, Fergie Jenkins, and Phil Niekro, all three of whom, either by peak (Gibson) or longevity (Niekro), rise above the JAWS threshold.
Another interesting variance is Don Sutton, who by JAWS falls between Tiant and John although FanGraphs too is bullish on Sutton as it is with John, valuing Sutton at a shade more than 18 fWAR wins better that his bWAR. Sutton does tend to be more of a compiler—his peak seven years are just below John's—who passed the plateaus of 300 wins and 3000 strikeouts, traditional milestones that in most cases have landed a pitcher in the Hall. By runs-allowed ratings, Sutton is closer to league-average than any of his Hall brethren, about comparable to John.
The table below details selected quantitative and qualitative statistics, ranked by earned run average, for Tommy John and Luis Tiant and their starting pitcher contemporaries, defined as those who played a significant amount of their careers between 1963 and 1989, the span of both John's career (1963 to 1989) and Tiant's career (1964 to 1982). John's and Tiant's statistics are marked in bold italic.
| Quantitative and Some Qualitative Pitching Statistics for Tommy John and Luis Tiant and Their Starting Pitching Contemporaries, Ranked by Earned Run Average |
|||||||
| |
W–L (Pct.) |
ERA |
IP |
GS |
BB |
SO |
WHIP |
| + Palmer, Jim |
268–152 (.638) |
2.86 |
3948 |
521 |
1311 |
2212 |
1.180 |
| + Seaver, Tom |
311–205 (.603) |
2.86 |
4783 |
647 |
1390 |
3640 |
1.121 |
| + Marichal, Juan |
243–142 (.631) |
2.89 |
3507 |
457 |
1126 |
2303 |
1.101 |
| + Gibson, Bob |
251–174 (.591) |
2.91 |
3884.1 |
482 |
1336 |
3117 |
1.188 |
| + Perry, Gaylord |
314–265 (.542) |
3.11 |
5350 |
690 |
1379 |
3534 |
1.181 |
| + Ryan, Nolan |
324–292 (.526) |
3.19 |
5386 |
773 |
2795 |
5714 |
1.247 |
| + Carlton, Steve |
329–244 (.574) |
3.22 |
5217.2 |
709 |
1833 |
4136 |
1.247 |
| Wood, Wilbur |
164–156 (.513) |
3.24 |
2684 |
297 |
724 |
1411 |
1.232 |
| + Sutton, Don |
324–256 (.559) |
3.26 |
5282.1 |
756 |
1343 |
3574 |
1.142 |
| Tiant, Luis |
229–172 (.571) |
3.30 |
3486.1 |
484 |
1104 |
2416 |
1.199 |
| + Blyleven, Bert |
287–250 (.534) |
3.31 |
4970 |
685 |
1322 |
3701 |
1.198 |
| + Jenkins, Fergie |
284–226 (.557) |
3.34 |
4500.2 |
594 |
997 |
3192 |
1.142 |
| John, Tommy |
288–231 (.555) |
3.34 |
4710.1 |
700 |
1259 |
2245 |
1.283 |
| + Niekro, Phil |
318–274 (.537) |
3.35 |
5404 |
716 |
1809 |
3342 |
1.268 |
Again, John and Tiant find themselves outclassed: Of the 11 Hall of Famers, six are in the 300-win club and nine are in the 3000-strikeout club. In fact, Tiant has the fewest wins of any pitcher in the sample other than Wood. John came within 12 wins of 300, and that has been the main argument for John's inclusion by the traditionalists, who point to Bert Blyleven as an example. In fact, Blyleven and John are near-identical in wins and ERA.
The table below details qualitative statistics for Tommy John and Luis Tiant and their starting pitcher contemporaries, ranked by adjusted earned run average plus.
| Qualitative Pitching Statistics for Tommy John and Luis Tiant and Their Starting Pitching Contemporaries, Ranked by Adjusted Earned Run Average Plus |
||||||||
| |
ERA+ |
ERA– |
FIP |
FIP– |
SO/9 |
SO/BB |
bWAR |
fWAR |
| + Gibson, Bob |
127 |
78 |
2.89 |
81 |
7.2 |
2.33 |
81.9 |
82.3 |
| + Seaver, Tom |
127 |
79 |
3.04 |
85 |
6.8 |
2.62 |
106.3 |
92.4 |
| + Palmer, Jim |
125 |
79 |
3.50 |
95 |
5.0 |
1.69 |
68.1 |
56.6 |
| + Marichal, Juan |
123 |
81 |
3.04 |
89 |
5.9 |
3.25 |
61.9 |
61.2 |
| + Blyleven, Bert |
118 |
85 |
3.19 |
82 |
6.7 |
2.80 |
96.5 |
102.9 |
| + Perry, Gaylord |
117 |
85 |
3.06 |
85 |
5.9 |
2.56 |
93.7 |
100.1 |
| + Carlton, Steve |
115 |
87 |
3.15 |
87 |
7.1 |
2.26 |
84.1 |
96.5 |
| + Jenkins, Fergie |
115 |
87 |
3.28 |
88 |
6.4 |
3.20 |
82.8 |
80.1 |
| + Niekro, Phil |
115 |
86 |
3.62 |
95 |
5.6 |
1.85 |
97.4 |
78.1 |
| Tiant, Luis |
114 |
87 |
3.47 |
92 |
6.2 |
2.19 |
66.1 |
54.8 |
| Wood, Wilbur |
114 |
88 |
3.37 |
92 |
4.7 |
1.95 |
52.2 |
36.9 |
| + Ryan, Nolan |
112 |
90 |
2.97 |
83 |
9.5 |
2.04 |
83.9 |
106.7 |
| John, Tommy |
111 |
90 |
3.38 |
89 |
4.3 |
1.78 |
62.3 |
79.4 |
| + Sutton, Don |
108 |
92 |
3.24 |
91 |
6.1 |
2.66 |
68.7 |
85.5 |
Not surprisingly, John and Tiant rank below most of their Hall of Fame contemporaries in qualitative ratings although Don Sutton and Nolan Ryan fall to the bottom of the sample in ERA+ as they measure closer to league-average than many of their fellow Hall of Famers. And here the gap between Blyleven and John widens in terms of FIP and FIP–, calculations of ERA that factor only those outcomes over which a pitcher has total control: home runs, strikeouts, and walks. Tiant, too, takes a run-prevention hit with FIP and FIP–.
The table below outlines seasonal awards and leaders statistics for John and Tiant and their contemporaries, ranked by the "black-ink test," or the weighted score of the number of times a player led his league in significant pitching statistics such as the "Triple Crown stats" (wins, earned run average, strikeouts) and others.
| Awards and Leaders Statistics for Tommy John and Luis Tiant and Their Starting Pitcher Contemporaries, Ranked by Black-Ink Test |
||||||||
| Player |
CYA |
CYA Top 5 |
MVP Top 10 |
All-Star |
Gold Glove |
RoY |
Black Ink |
Gray Ink |
| + Ryan, Nolan |
0 |
6 |
0 |
8 |
0 |
0 |
84 |
254 |
| + Carlton, Steve |
4 |
6 |
5 |
10 |
1 |
0 |
69 |
285 |
| + Seaver, Tom |
3 |
8 |
5 |
12 |
0 |
1 |
57 |
292 |
| + Palmer, Jim |
3 |
8 |
2 |
6 |
4 |
0 |
44 |
209 |
| + Niekro, Phil |
0 |
3 |
1 |
5 |
5 |
0 |
43 |
194 |
| + Marichal, Juan |
0 |
0 |
3 |
9 |
0 |
0 |
37 |
197 |
| + Jenkins, Fergie |
1 |
5 |
2 |
3 |
0 |
0 |
36 |
206 |
| + Perry, Gaylord |
2 |
4 |
2 |
5 |
0 |
0 |
29 |
252 |
| Wood, Wilbur |
0 |
3 |
2 |
3 |
0 |
0 |
21 |
86 |
| + Gibson, Bob |
2 |
3 |
2* |
8 |
9 |
0 |
20 |
207 |
| + Blyleven, Bert |
0 |
3 |
0 |
2 |
0 |
0 |
16 |
237 |
| Tiant, Luis |
0 |
2 |
2 |
3 |
0 |
0 |
13 |
112 |
| John, Tommy |
0 |
3 |
0 |
4 |
0 |
0 |
11 |
134 |
| + Sutton, Don |
0 |
5 |
0 |
4 |
0 |
0 |
8 |
243 |
CYA: Cy Young Award.
CYA Top 5: Number of times a player finished in the top 5 of his league's Cy Young Award voting. Includes a Cy Young Award MVP win.
MVP Top 10: Number of times a player finished in the top 10 of his league's MVP voting. Includes an MVP win. (*) Indicates that the pitcher won at least one MVP Award.
Black Ink Test: Weighted measurement of times a pitcher led his league in significant pitching statistics. An average Hall of Famer has a measurement of about 40. Developed by Baseball Reference from a creation by Bill James.
Gray-Ink Test: Weighted measurement of times a pitcher appeared in the top ten of his league in significant pitching statistics. An average Hall of Famer has a measurement of about 185. Developed by Baseball Reference from a creation by Bill James.
No prizes for having guessed that John and Tiant again fall to the bottom of the sample—neither won a Cy Young Award, with Tiant having finished in Cy Young top-five voting twice and John three times, the same as Blyleven. However, Tiant did have two top-ten finishes for the American League's Most Valuable Player Award, first in 1968, when he won 21 games against only nine losses for a sterling .700 win-loss percentage and led the AL with a 1.60 ERA while pitching for the Cleveland Indians—although Denny McLain's 31-win season for the Detroit Tigers notched him the AL Cy Young—and again in 1972, when Tiant led the Majors with a 1.91 ERA while pitching for the Boston Red Sox, the team with which he is associated.
John had a four-year run of consecutive top-ten finishes for the Cy Young Award from 1977 to 1980, a period in which he won 20 or more games three times—a period following his ulnar collateral ligament reconstruction surgery and rehabilitation from same—including his 1977 campaign that saw him win 20 games for the Los Angeles Dodgers while losing just seven games for a terrific .741 win-loss percentage. In fact, 1978 was the only year of the four with fewer than 20 wins (17) a win-loss percentage south of .700 (.630).
In term of black ink, or league-leading finishes in significant categories, both John and Tiant fall well short of the standard for typical Hall of Famers, although even among the Hall of Famers in this sample, several of them, including Blyleven, also fall short. However, in gray ink, or top-ten finishes in significant categories, both pitchers again remain well below the bar while Blyleven and Don Sutton, John's teammate in the mid-1970s, do exceed the mark expected of the typical Hall of Famer.
Moreover, both Blyleven and Sutton did reach the traditional milestones of 300 wins and 3000 strikeouts, with Blyleven, as we noted above, posting two Gaudy Stats in strikeouts and shutouts, with Sutton just two shutouts shy of Blyleven's 60. Yet both John and Tiant also compiled a healthy number of shutouts too: Tiant's 49 blanks rank 21st (tied with Don Drysdale, Fergie Jenkins, and Early Wynn) while John's 46 rank 26th (tied with Roger Clemens and Jack Powell). In fact, of pitchers with 45 or more shutouts all-time, only Clemens, Powell, and Doc White are not in the Hall of Fame along with Tommy John and Luis Tiant.
Both John and Tiant help define the bubble, the threshold between appearing on the stage in Cooperstown and watching from the audience, Tiant more so qualitatively, John more so quantitatively. Tiant, in addition to 15 years on a BBWAA ballot, has been evaluated by a good half-dozen different veterans committees, making him the Susan Lucci of recent Hall of Fame candidates. Television soap-opera legend Lucci finally did win a Daytime Emmy Award in 1999, her 19th try since 1978. Can Tiant break the bubble and get into the Hall of Fame this year?
Luis Tiant
While pitching for the Cleveland Indians, Luis Tiant experienced a curious reversal between his 1968 season and his 1969 season: In 1968, the last year of the 15-inch-high pitching mound, and a year that saw St. Louis Cardinals ace Bob Gibson set the live-ball-era record with a 1.12 ERA while Detroit Tigers hurler Denny McLain become the last pitcher to win 30 or more games in a single season (he won 31), Tiant posted an outstanding 21–9 (.700) record with an American League-leading 1.60 ERA (he also led the league, retrospectively, with his 186 ERA+). He also led the AL in shutouts with 9, with 4 of those consecutive shutouts, for an Indians team that won 86 games.
However, in 1969, as the pitching mound fell to 10 inches and the Indians fell to 62 wins, he effectively reversed his record from the previous year: Tiant won just 9 games while leading the AL in losses with 20 as his ERA rose to 3.71 and he led the AL in home runs allowed (37) and walks (129). Injuries might have plagued him during the season—although he pitched in and started more games than in the previous season—but he eventually found his way to Boston in 1971 and a new lease of life.
During his eight seasons with the Red Sox, Tiant in 274 games (238 of those starts) and 1774.2 innings pitched amassed a 122–81 win-loss record (a .601 winning percentage) while reaching the 20-win plateau three times; during that period, his ERA was 3.36 as he notched 113 complete games including 26 shutouts and compiled 1075 strikeouts, a 118 ERA+, and a bWAR of 36.4, all quite impressive for a pitcher between his age-30 and age-37 seasons. With Boston, the right-hander with the distinctive, deceptive delivery did win another ERA crown with his 1.91 ERA in 1972 (his 169 ERA+ also led the AL).
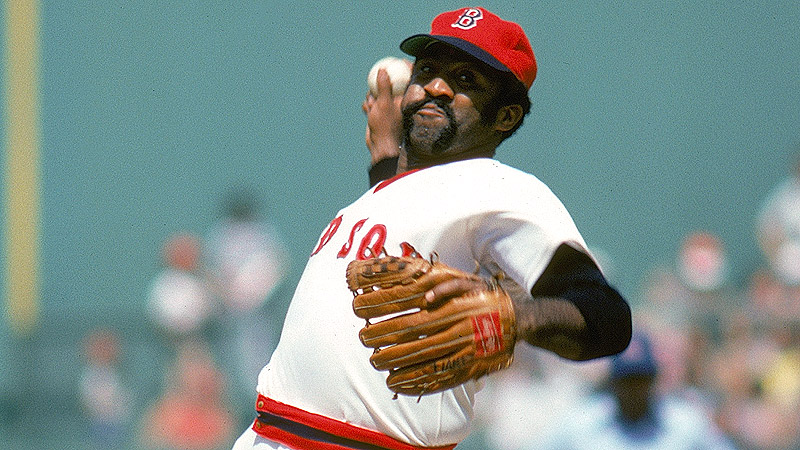
Luis Tiant delivers. Still a legend in Boston, can Tiant break the bubble this year and deliver himself to Cooperstown?
Of the three pitchers the Modern Baseball Committee is evaluating this year, Luis Tiant is the strongest candidate for the Hall of Fame. He is 6.5 wins below the JAWS average for all starting pitchers in the Hall, but although Tiant had a few strong seasons—he had six seasons in which his bWAR was 5.0 or better, indicating an All-Star-level pitcher—he never had a dominant peak (his WAR7, or best seven season by bWAR, of 44.6 falls nearly six wins below the Hall average of 50.3), and in 19 seasons he never compiled counting numbers significant enough to demand attention.
And although he kept the Red Sox alive with two of three wins during that legendary 1975 World Series against the Cincinnati Reds, and had pitched a Game One gem in the preceding American League Championship Series against the defending champion Oakland Athletics, a complete-game victory in which he allowed just three hits and one earned run, Tiant does not have postseason immortality to tip the balance there, either.
Luis Tiant is destined to be baseball's Susan Lucci again this year, an excellent pitcher who showed flashes of brilliance at times but whose overall career falls short of Cooperstown.
Tommy John
Because of the surgery named for him, Tommy John wound up pitching until his age-46 season in 1989, after he began his career in 1963, and by a seemingly irrelevant coincidence, the original version of the British science-fiction series Doctor Who also ran from 1963 to 1989.
However, Doctor Who might have ended in 1966: Actor William Hartnell, who first played the titular Time Lord, had to leave the show because of failing health, putting the future of this time-travel series in jeopardy. But then the series hit upon the idea of "regeneration," or reincarnation of the Doctor into another form, that explained why a new actor was now playing the same character. (Maybe not so) similarly, Tommy John's career might have ended were it not for the "regeneration" of his pitching arm through Dr. Frank Jobe's surgery.
Not only did Jobe's surgery enable John to continue pitching, but it may have prolonged his career until age 46, although being a soft-tossing lefty can also be an advantage in the Major Leagues, to which Jamie Moyer and Jesse Orosco can attest. John's longevity did enable him to compile the highest number of wins of all pitchers in the modern era who did not reach the 300-win plateau. And like Moyer, John established impressive marks in categories based on longevity: games started (700), eighth all-time; hits allowed (4783), 10th all-time; earned runs allowed (1749), 16th all-time; losses (231), 19th all-time; innings pitched (4710.1), 20th all-time; wins (288) and shutouts (46), both 26th all-time; home runs allowed (302), 55th all-time; strikeouts (2245), 56th all-time; and appearances (760), 66th all-time.
On the other hand, those categories are a mixed bag of positive and negative—was the surgery to repair his arm, and thus allow him to prolong his career to age 46, also a mixed bag? In other words, did Tommy John, given a new lease of life to pitch again, pitch for too long—and thus affect his chances for the Hall of Fame?
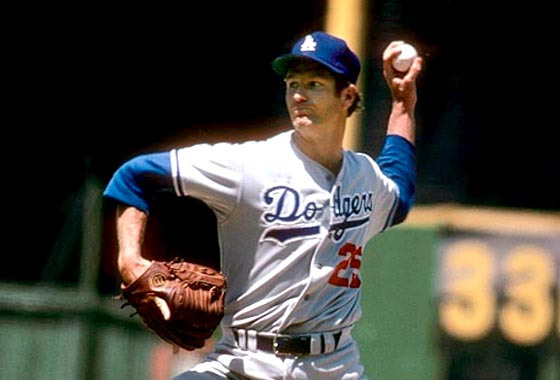
The surgery named for him prolonged Tommy John's career--but did it also allow him to pitch too long for Hall of Fame acceptance?
The following table lists John's performance in the 12 years before his 1974 surgery, the first seven years following his surgery, and the final seven years of his career. The Totals rows reflect John's first 20 years in the Major Leagues (19 seasons—he did not play in 1975), John's seasons following his surgery, and his entire career.
| Tommy John's Pitching Performance by Period |
|||||||
| Period |
W-L (Pct.) |
GS |
ERA |
ERA+ |
ERA– |
bWAR |
fWAR |
| 1963–1974 |
124–106 (.539) |
318 |
2.97 |
116 |
85 |
31.0 |
34.2 |
| 1976–1982 |
113–65 (.635) |
217 |
3.15 |
120 |
83 |
24.7 |
28.6 |
| Totals, 1963–1982 |
237–171 (.581) |
535 |
3.05 |
118 |
84 |
55.7 |
66.8 |
| 1983–1989 |
51–60 (.459) |
165 |
4.43 |
92 |
112 |
6.6 |
12.4 |
| Totals, 1976–1989 |
164–125 (.567) |
382 |
3.66 |
107 |
98 |
31.3 |
41.0 |
| Totals, Entire Career |
288–231 (.555) |
700 |
3.34 |
111 |
90 |
62.3 |
75.2 |
But although hindsight is a luxury, it also shows that John prolonged his career to the detriment of his overall effectiveness. From 1983 to 1989, his age-40 to age-46 seasons, John was a below-league-average pitcher, scratching to add to his win totals as the quality of his pitching plummeted. Had Tommy John retired following the 1982 season, or even the 1983 season as he realized that, at age 40, he was no longer a top-flight pitcher, reconstructed arm or not, he might have appeared to be a more promising Hall of Fame candidate.
Retiring after 1983, his age-40 season, would have had John post a 248–184 win-loss record, a .574 winning percentage, with a 3.12 ERA, a 3.24 FIP, and a 116 ERA+. He would have compiled 569 games started, 154 complete games, 44 shutouts, 3944.1 innings pitched, 1983 strikeouts, and 1045 walks. His bWAR would have been 57.8.
By adding just one season, in 1983, to his career, John might have added 11 wins to his career total—but he also added 13 losses to his career total. His ERA rose and his ERA+ fell while adding 2.1 wins above a replacement player to his career bWAR. And although John had a winter renaissance of sorts in 1987, his age-44 season with the New York Yankees, as he won 13 games and lost only six in 33 starts and 187.2 innings pitched, it was his last gasp as a pitcher. (And at least his 4.03 ERA was offset by a 3.88 FIP and a 110 ERA+.)
Would an earlier retirement have helped Tommy John? Perhaps it would have made a stronger qualitative case for him, but John was ultimately a compiler at any stage of his career. His JAWS statistics are well below the aggregates for pitchers already in the Hall of Fame, and unlike Bert Blyleven, whose record bears many similarities to John's, John does not have the Gaudy Stat or Standout Season that Blyleven has to buttress his case. Tommy John is not a Hall of Fame-caliber pitcher.
Jack Morris
So, if Tommy John and Luis Tiant don't reach the bar for Hall of Fame pitchers, does Jack Morris stand a chance?
In one sense, yes. Of Jack Morris's starting pitcher contemporaries, whose playing careers had a significant intersection with the span of Morris's career from 1977 to 1994, only four of them are currently in the Hall of Fame—Tom Glavine, Randy Johnson, Greg Maddux, and John Smoltz—while Curt Schilling, still on the BBWAA ballot, should have joined them already. So, unlike John and Tiant, whose careers are buried behind the 11 Hall of Famers who are their contemporaries, Morris does not have that many legendary lights with whom to contend.
And in another sense, yes. By winning four world championships with three different teams, Morris established himself as a money pitcher, particularly in 1991 with the Minnesota Twins when he was named the World Series MVP, culminating with his Game Seven win against future Hall of Famer Smoltz and his Atlanta Braves. Morris also proved his worth over the long haul, both in-season and during his career, as he led the American League in wins twice, had twelve years with 15 or more wins and three years with 20 or more wins, and won 254 games all told. (And had 1981 not been a strike-shortened season, Morris, with 14 wins already, would likely have won at least one more game, giving him ten consecutive years with 15 or more wins.)
But despite a late push for Morris's Hall of Fame candidacy in the 2010s, he fell 7.3 percent short of the 75-percent threshold in 2013, his best showing on a BBWAA ballot, before drawing 61.5 percent of the vote the following year, his last chance on the writers' ballot. This is Morris's first time on a post-BBWAA ballot.
The table below details the Hall of Fame statistics for Jack Morris and his starting pitcher contemporaries, defined as those who played a significant amount of their careers between 1977 and 1994, the span of Morris's career. Aggregate JAWS statistics are marked in bold; Morris's statistics are marked in bold italic. Also included are Hall of Fame statistics for Hall of Famer Jim "Catfish" Hunter, whose playing career falls into the era of John and Tiant but whose JAWS rankings are very similar to Morris's.
| Hall of Fame Statistics for Jack Morris and His Starting Pitcher Contemporaries, Ranked by JAWS |
|||||||||
| Player |
fWAR |
bWAR |
WAR7 |
JAWS |
JAWS Rank |
HoF Mon. (≈100) |
HoF Std. (≈50) |
ERA+ |
ERA– |
| + Johnson, Randy |
110.6 |
102.1 |
62.0 |
82.0 |
9 |
331 |
65 |
135 |
75 |
| + Maddux, Greg |
116.7 |
106.9 |
56.3 |
81.6 |
10 |
254 |
70 |
132 |
76 |
| = Schilling, Curt |
79.8 |
79.9 |
49.0 |
64.5 |
27 |
171 |
46 |
127 |
80 |
| + Glavine, Tom |
66.9 |
81.5 |
44.3 |
62.9 |
30 |
176 |
52 |
118 |
86 |
| ALL HoF PITCHERS |
NA |
73.9 |
50.3 |
62.1 |
NA |
NA |
NA |
NA |
NA |
| Reuschel, Rick |
68.2 |
70.0 |
43.8 |
56.9 |
45 |
48 |
31 |
114 |
88 |
| Brown, Kevin |
76.5 |
68.3 |
45.4 |
56.9 |
46 |
93 |
41 |
127 |
78 |
| + Smoltz. John |
79.6 |
69.5 |
38.8 |
54.2 |
58 |
162 |
44 |
125 |
81 |
| Cone, David |
56.0 |
62.5 |
43.5 |
53.0 |
62 |
103 |
39 |
121 |
84 |
| Saberhagen, Bret |
55.3 |
59.2 |
43.3 |
51.3 |
67 |
70 |
32 |
126 |
80 |
| Stieb, Dave |
43.8 |
57.2 |
44.8 |
51.0 |
69 |
56 |
27 |
122 |
82 |
| Finley, Chuck |
56.9 |
58.4 |
39.8 |
49.1 |
77 |
54 |
27 |
115 |
87 |
| Hershiser, Orel |
48.0 |
56.8 |
40.4 |
48.6 |
80 |
90 |
34 |
112 |
89 |
| Tanana, Frank |
58.5 |
57.9 |
38.5 |
48.2 |
84 |
55 |
35 |
106 |
94 |
| Langston, Mark |
49.2 |
50.7 |
41.8 |
46.2 |
94 |
64 |
23 |
107 |
93 |
| Gooden, Dwight |
56.7 |
53.2 |
39.1 |
46.1 |
97 |
88 |
40 |
111 |
90 |
| Key, Jimmy |
45.0 |
49.6 |
36.9 |
43.3 |
120 |
66 |
33 |
122 |
82 |
| Guidry, Ron |
49.3 |
48.1 |
38.1 |
43.1 |
121 |
106 |
38 |
119 |
83 |
| Wells, David |
58.3 |
53.6 |
31.4 |
42.5 |
124 |
87 |
40 |
108 |
93 |
| = Moyer, Jamie |
48.2 |
50.4 |
33.2 |
41.8 |
132 |
56 |
39 |
103 |
97 |
| Martinez, Dennis |
49.1 |
49.3 |
33.5 |
41.4 |
134 |
67 |
37 |
106 |
94 |
| Rogers, Steve |
49.8 |
45.1 |
37.1 |
41.1 |
137 |
48 |
23 |
116 |
87 |
| Matlack, Jon |
44.9 |
39.7 |
37.2 |
38.4 |
163 |
35 |
19 |
114 |
87 |
| Morris, Jack |
55.8 |
44.1 |
32.8 |
38.4 |
164 |
122 |
39 |
105 |
95 |
| + # Hunter, Jim |
37.2 |
41.4 |
35.1 |
38.3 |
166 |
134 |
42 |
104 |
94 |
| Valenzuela, Fernando |
40.9 |
42.1 |
33.9 |
38.0 |
168 |
66 |
25 |
104 |
96 |
| Candiotti, Tom |
38.9 |
41.5 |
34.1 |
37.8 |
169 |
12 |
17 |
108 |
92 |
= On 2018 Baseball Writers' Association of America ballot.
# Not a contemporary of Jack Morris but with very similar Hall of Fame statistics.
In fairness, using the JAWS system to rank Morris against his contemporaries can create a skewed impression—Morris's rank of 164th all-time by JAWS generates a lot of contemporaries, many of whom had nowhere near the notability Morris had during their careers.
This makes Morris the poster boy for the traditionalists' opposition to the stat-heads, whose JAWS system devised by Jay Jaffe does not take into account the traditionalists' argument—that Morris "pitched to the score" with little regard to his own stats, and as a result, he won a lot of games for his teams, which is the point of the game.
The table below details selected quantitative and qualitative statistics, ranked by earned run average, for Jack Morris and his starting pitcher contemporaries, defined as those who played a significant amount of their careers between 1977 and 1994, the span of Morris's career. Morris's statistics are marked in bold italic.
| Quantitative and Some Qualitative Pitching Statistics for Jack Morris and His Starting Pitching Contemporaries, Ranked by Earned Run Average |
|||||||
| |
W–L (Pct.) |
ERA |
IP |
GS |
BB |
SO |
WHIP |
| + Maddux, Greg |
355–227 (.610) |
3.16 |
5008.1 |
740 |
999 |
3371 |
1.143 |
| Rogers, Steve |
158–152 (.510) |
3.17 |
2837.2 |
393 |
876 |
1621 |
1.232 |
| Matlack, Jon |
125–126 (.498) |
3.18 |
2363 |
318 |
638 |
1516 |
1.233 |
| + # Hunter, Catfish |
224–166 (.574) |
3.26 |
3449.1 |
476 |
954 |
2012 |
1.134 |
| Brown, Kevin |
211–144 (.594) |
3.28 |
3256.1 |
476 |
901 |
2397 |
1.222 |
| Guidry, Ron |
190–91 (.651) |
3.29 |
2392 |
323 |
633 |
1778 |
1.184 |
| + Johnson, Randy |
303–166 (.646) |
3.29 |
4135.1 |
603 |
1497 |
4875 |
1.171 |
| + Smoltz. John |
213–155 (.579) |
3.33 |
3473 |
481 |
1010 |
3084 |
1.176 |
| Saberhagen, Bret |
167–117 (.588) |
3.34 |
2562.2 |
371 |
471 |
1715 |
1.141 |
| Reuschel, Rick |
214–191 (.528) |
3.37 |
3548.1 |
529 |
935 |
2015 |
1.275 |
| Stieb, Dave |
176–137 (.562) |
3.44 |
2895.1 |
412 |
1034 |
1669 |
1.245 |
| Cone, David |
194–126 (.606) |
3.46 |
2898.2 |
419 |
1137 |
2668 |
1.256 |
| = Schilling, Curt |
216–146 (.597) |
3.46 |
3261 |
436 |
711 |
3116 |
1.137 |
| Hershiser, Orel |
204–150 (.576) |
3.48 |
3130.1 |
466 |
1007 |
2014 |
1.261 |
| Gooden, Dwight |
194–112 (.634) |
3.51 |
2800.2 |
410 |
954 |
2293 |
1.256 |
| Key, Jimmy |
186–117 (.614) |
3.51 |
2591.2 |
389 |
668 |
1538 |
1.229 |
| + Glavine, Tom |
305–203 (.600) |
3.54 |
4413.1 |
682 |
1500 |
2607 |
1.314 |
| Valenzuela, Fernando |
173–153 (.531) |
3.54 |
2930 |
424 |
1151 |
2074 |
1.320 |
| Tanana, Frank |
240–236 (.504) |
3.66 |
4188.1 |
616 |
1255 |
2773 |
1.270 |
| Martinez, Dennis |
245–193 (.559) |
3.70 |
3999.2 |
562 |
1165 |
2149 |
1.266 |
| Candiotti, Tom |
151–164 (.479) |
3.73 |
2725 |
410 |
883 |
1735 |
1.301 |
| Finley, Chuck |
200–173 (.536) |
3.85 |
3197.1 |
467 |
1332 |
2610 |
1.376 |
| Morris, Jack |
254–186 (.577) |
3.90 |
3824 |
527 |
1390 |
2478 |
1.296 |
| Langston, Mark |
179–158 (.531) |
3.97 |
2962.2 |
428 |
1289 |
2464 |
1.354 |
| Wells, David |
239–157 (.604) |
4.13 |
3439 |
489 |
719 |
2201 |
1.266 |
| = Moyer, Jamie |
269–209 (.563) |
4.25 |
4074 |
638 |
1155 |
2441 |
1.322 |
= On 2018 Baseball Writers' Association of America ballot.
# Not a contemporary of Jack Morris but with very similar Hall of Fame statistics.
Even by a traditionalists' statistic, earned run average, Morris still falls to the bottom of the sample. If elected to the Hall of Fame, Morris's career 3.90 ERA would be the highest by any pitcher in the Hall, besting Red Ruffing's 3.80 ERA—and as Morris's career ended in 1994, before the Steroids Era began, his is not a case of inflated ERAs incurred during that period.
The table below details qualitative statistics for Jack Morris and his starting pitcher contemporaries, ranked by adjusted earned run average plus.
| Qualitative Pitching Statistics for Jack Morris Tiant and His Starting Pitching Contemporaries, Ranked by Adjusted Earned Run Average Plus |
||||||||
| |
ERA+ |
ERA– |
FIP |
FIP– |
SO/9 |
SO/BB |
bWAR |
fWAR |
| + Johnson, Randy |
135 |
75 |
3.19 |
73 |
10.6 |
3.26 |
104.3 |
110.6 |
| + Maddux, Greg |
132 |
76 |
3.26 |
78 |
6.1 |
3.37 |
104.6 |
116.7 |
| Brown, Kevin |
127 |
78 |
3.33 |
78 |
6.6 |
2.66 |
68.5 |
76.5 |
| = Schilling, Curt |
127 |
80 |
3.23 |
76 |
8.6 |
4.38 |
80.7 |
79.8 |
| Saberhagen, Bret |
126 |
80 |
3.27 |
81 |
6.0 |
3.64 |
59.1 |
55.3 |
| + Smoltz. John |
125 |
81 |
3.24 |
78 |
8.0 |
3.05 |
66.5 |
79.6 |
| Key, Jimmy |
122 |
82 |
3.80 |
89 |
5.3 |
2.30 |
49.4 |
45.0 |
| Stieb, Dave |
122 |
82 |
3.82 |
93 |
5.2 |
1.59 |
57.0 |
43.8 |
| Cone, David |
121 |
84 |
3.57 |
85 |
8.3 |
2.35 |
61.7 |
56.0 |
| Guidry, Ron |
119 |
83 |
3.27 |
82 |
6.7 |
2.81 |
47.9 |
49.3 |
| + Glavine, Tom |
118 |
86 |
3.95 |
94 |
5.3 |
1.74 |
74.0 |
66.9 |
| Rogers, Steve |
116 |
87 |
3.20 |
88 |
5.1 |
1.85 |
45.3 |
49.8 |
| Finley, Chuck |
115 |
87 |
3.91 |
88 |
7.3 |
1.96 |
58.5 |
56.9 |
| Matlack, Jon |
114 |
87 |
3.06 |
84 |
5.8 |
2.38 |
39.1 |
44.9 |
| Reuschel, Rick |
114 |
88 |
3.22 |
85 |
5.1 |
2.16 |
68.2 |
68.2 |
| Hershiser, Orel |
112 |
89 |
3.69 |
93 |
5.8 |
2.00 |
51.7 |
48.0 |
| Gooden, Dwight |
111 |
90 |
3.33 |
83 |
7.4 |
2.40 |
48.2 |
56.7 |
| Candiotti, Tom |
108 |
92 |
3.91 |
95 |
5.7 |
1.96 |
42.5 |
38.9 |
| Wells, David |
108 |
93 |
3.99 |
90 |
5.8 |
3.06 |
53.5 |
58.3 |
| Langston, Mark |
107 |
93 |
3.94 |
91 |
7.5 |
1.91 |
50.3 |
49.2 |
| Martinez, Dennis |
106 |
94 |
3.91 |
99 |
4.8 |
1.84 |
49.5 |
49.1 |
| Tanana, Frank |
106 |
94 |
3.79 |
96 |
6.0 |
2.21 |
57.5 |
58.3 |
| Morris, Jack |
105 |
95 |
3.94 |
95 |
5.8 |
1.78 |
43.8 |
55.8 |
| + # Hunter, Catfish |
104 |
94 |
3.66 |
103 |
5.2 |
2.11 |
36.6 |
37.2 |
| Valenzuela, Fernando |
104 |
96 |
3.61 |
96 |
6.4 |
1.80 |
37.4 |
40.9 |
| = Moyer, Jamie |
103 |
97 |
4.47 |
102 |
5.4 |
2.11 |
50.2 |
48.2 |
= On 2018 Baseball Writers' Association of America ballot.
# Not a contemporary of Jack Morris but with very similar Hall of Fame statistics.
Even when ERAs are park- and league-adjusted, Morris emerges as little better than a league-average pitcher in terms of run prevention among his contemporaries, either by ERA+ or ERA–, while FIP doesn't help him, either—measured by those factors that Morris could control, he was slightly worse.
Traditionalists would argue that this is part of Morris's "pitching to the score," that what mattered is that Morris helped win the game for his teams. Yet the best way a pitcher can help his team win is through run prevention—not letting the other team score runs. Isn't that the point of the game?
The counter is that the point is who wins and who loses. In his career, Jack Morris had 61 tough losses, defined as a loss in which the pitcher had a quality start, defined as pitching six or more innings while allowing three or fewer earned runs, but his team could not score enough runs to win the game for him. Of his 527 starts, Morris had 297 quality starts, or 56 percent of his total starts, with the Major League average during his career being 52 percent. If Morris's teams could have converted three-quarters of those tough losses into wins, we could be looking at a 300-game winner. Alternatively, Morris left 30 games in which he had the lead, but the relievers who followed him allowed the other team to tie or take the lead.
On the other hand, Morris left 38 games in which he was in line to take the loss, but his team rebounded to at least tie the score, thus getting him off the hook. Furthermore, Morris, with a career 3.90 ERA, won 53 games in which he had a non-quality start, pitching fewer than six innings or surrendering more than three earned runs. Throughout his career, Morris's teams averaged 4.9 runs scored in games in which he pitched, and 4.7 runs scored during innings in which he pitched in those games; MLB averages during this time were 4.4 runs scored and 4.1 runs scored, respectively.
Perhaps Morris did indeed "pitch to the score," with his teams, by and large, able to score more runs than their opponents even if those opponents enjoyed the 3.90 earned runs Morris allowed them, on average, throughout his career. Batters posted a career slash line of .247/.313/.380/.693 against Morris, which is still better than the .260/.326/.390/.716 slash line across the MLB during this time—but how many of the pitchers who surrendered those hits and walks are being considered for the Hall of Fame?
Jack Morris's performance in the 1991 World Series is legendary--but how critical to his success were his teammates?
Furthermore, Morris's career BAbip, or batting average on balls in play, of .272, 14 points better (lower) than the MLB's .286, is a reflection of the defenses playing behind Morris, who spent the first 14 years of his 18-year career, from 1977 to 1990, with the Detroit Tigers. In this article, we have already seen one defender who played behind Morris—Alan Trammell, who is one of the best shortstops in Major League history. Trammell's long-time keystone partner was Lou Whitaker, whom JAWS ranks as 13th all-time among second basemen.
In 1991, Morris pitched for the Minnesota Twins, with shortstop Greg Gagne, second baseman Chuck Knoblauch, and center fielder Kirby Puckett playing up the middle. The next two seasons found Morris with the Toronto Blue Jays, whose defenders included Roberto Alomar, Tony Fernandez, John Olerud, and Devon White, with Alomar one of the best second basemen in MLB history.
Jack Morris may have been a battler who "pitched to the score," but to win 254 games, he was dependent upon his fielders to make plays behind him, and on his team's hitters to score more runs than the 3.90 earned runs he allowed on average in every start. (And as an exclusively American League pitcher before interleague play commenced in 1998, he couldn't even help his cause at the plate as the designated hitter batted for him.)
The table below outlines seasonal awards and leaders statistics for Morris and his contemporaries, ranked by the "black-ink test," or the weighted score of the number of times a player led his league in significant pitching statistics such as the "Triple Crown stats" (wins, earned run average, strikeouts) and others.
| Awards and Leaders Statistics for Jack Morris and His Starting Pitcher Contemporaries, Ranked by Black-Ink Test |
||||||||
| Player |
CYA |
CYA Top 5 |
MVP Top 10 |
All-Star |
Gold Glove |
RoY |
Black Ink |
Gray Ink |
| + Johnson, Randy |
5 |
9 |
2 |
10 |
0 |
0 |
99 |
280 |
| + Maddux, Greg |
4 |
9 |
2 |
8 |
18 |
0 |
87 |
336 |
| = Schilling, Curt |
0 |
4 |
2 |
6 |
0 |
0 |
42 |
205 |
| + Smoltz. John |
1 |
3 |
1 |
8 |
0 |
0 |
34 |
199 |
| + Glavine, Tom |
2 |
6 |
1 |
10 |
0 |
0 |
29 |
202 |
| Guidry, Ron |
1 |
5 |
1 |
4 |
5 |
0 |
29 |
140 |
| + # Hunter, Catfish |
1 |
4 |
2 |
8 |
0 |
0 |
26 |
151 |
| Wells, David |
0 |
2 |
0 |
3 |
0 |
0 |
24 |
123 |
| Gooden, Dwight |
1 |
4 |
1 |
4 |
0 |
1 |
23 |
139 |
| Morris, Jack |
0 |
5 |
0 |
5 |
0 |
0 |
20 |
193 |
| Hershiser, Orel |
1 |
4 |
1 |
3 |
1 |
0 |
20 |
129 |
| Saberhagen, Bret |
2 |
3 |
2 |
3 |
1 |
0 |
20 |
127 |
| Cone, David |
1 |
4 |
2 |
5 |
0 |
0 |
19 |
168 |
| Brown, Kevin |
0 |
4 |
0 |
6 |
0 |
0 |
19 |
166 |
| Valenzuela, Fernando |
1 |
4 |
1 |
6 |
1 |
1 |
19 |
140 |
| Stieb, Dave |
0 |
2 |
0 |
7 |
0 |
0 |
17 |
142 |
| Martinez, Dennis |
0 |
2 |
0 |
4 |
0 |
0 |
17 |
134 |
| Key, Jimmy |
0 |
3 |
1 |
4 |
0 |
0 |
15 |
99 |
| Langston, Mark |
0 |
1 |
0 |
4 |
7 |
0 |
12 |
134 |
| Tanana, Frank |
0 |
2 |
0 |
3 |
0 |
0 |
9 |
85 |
| Rogers, Steve |
0 |
3 |
0 |
5 |
0 |
0 |
8 |
134 |
| Reuschel, Rick |
0 |
2 |
0 |
3 |
2 |
0 |
7 |
111 |
| Finley, Chuck |
0 |
0 |
0 |
5 |
0 |
0 |
6 |
156 |
| Matlack, Jon |
0 |
0 |
0 |
3 |
0 |
1 |
4 |
94 |
| = Moyer, Jamie |
0 |
3 |
0 |
1 |
0 |
0 |
3 |
106 |
| Candiotti, Tom |
0 |
0 |
0 |
0 |
0 |
0 |
2 |
62 |
= On 2018 Baseball Writers' Association of America ballot.
# Not a contemporary of Jack Morris but with very similar Hall of Fame statistics.
Here Jack Morris rises above the majority of his contemporaries. Morris did have five seasons in which he finished in the top five of American League Cy Young Award voting. He finished third in 1981, a year in which Milwaukee Brewers reliever Rollie Fingers won, a vote that has long been criticized, with the runner-up, the Oakland Athletics' Steve McCatty, a better choice than either one. Morris did not get robbed in any of his other high Cy Young finishes. Morris also scores highly in gray ink, with many top-ten finishes in several significant categories.
In 13 postseason starts, Jack Morris won seven games, lost four, and posted a 3.80 ERA, although a closer look gives a different picture—one that begins to justify his reputation as money picture. He did pitch much better overall in World Series games than in American League Championship Series games, in which he had a 3–2 win-loss record in six starts with a 4.87 ERA; by contrast, his World Series record is 4–2 in seven starts with a 2.96 ERA. (Morris did not play in the Blue Jays' 1993 postseason due to injuries.)
But in 1992, despite an outstanding regular-season campaign that saw him win 21 games, Morris collapsed in the postseason, losing one game in two starts against Oakland in the ALCS with a disastrous 6.57 ERA and two games in both his starts against the Atlanta Braves in the World Series with an even worse 8.44 ERA. Factoring out those series, Morris is 3–1 in the ALCS with a 4.16 ERA, an improvement but hardly sterling.
For the World Series, however, he is a perfect 4–0 with a 1.54 ERA including three complete games in five starts and one shutout. That shutout was with the Twins in Game Seven of the 1991 World Series against the Braves, a 1–0 victory in ten innings as Morris outdueled Smoltz. In three starts altogether, Morris won one other game, in Game One, while posting a 1.17 ERA; he was named the World Series MVP, although arguably he was better with the Tigers in the 1984 World Series as they beat the San Diego Padres in five games. Morris won two of those, both complete-game victories, as he allowed just four earned runs in 18 innings for a 2.00 ERA, striking out 13 batters and walking just three. (Alan Trammell was named the 1984 World Series MVP.)
Jack Morris's postseason heroics recall those of Catfish Hunter, who won five World Series rings between 1972 and 1978, three with the A's from 1972 to 1974, and two with the New York Yankees in back-to-back years, 1977 and 1978. Hunter did win a Cy Young in 1974 (although there were other worthy candidates including Luis Tiant), and Hunter was elected to the Hall of Fame on his third try in 1987.
Hunter nudged past the bar with 76.3 percent of the vote, suggesting that BBWAA voters were not convinced of the right-hander's qualifications, and subsequent analysis has shown that to be the case. Hunter's profile looks very similar to Morris's. Their JAWS scores are virtually identical, and while Morris has a higher bWAR by dint of a longer career, Hunter had a marginally better seven-year peak.
Hunter's BAbip of .246 against the MLB's .279 suggests good defensive play behind Hunter, particularly as his FIP of 3.66 is four-tenths of a run higher than his 3.26 ERA. Hunter too enjoyed run support that was higher than MLB averages, although the margins are narrower for him than they are for Morris. Catfish Hunter's 104 ERA+ and marginally better 94 ERA– mark him as a starting pitcher a little better than a league-average starter, not an insult but neither a ringing endorsement for the Hall of Fame.
Jack Morris fares the same. In fact, Morris is his era's Catfish Hunter—a big-game pitcher who shone when the spotlight was on him at center stage, but one whose overall career, while impressive, does not rise to greatness. Hunter was elected to the Hall of Fame, and it is likely that Morris will get the nod from the Modern Baseball Committee, if not in 2018 then in a subsequent year. But that would be a mistake. Jack Morris is not a Hall of Famer.

Comments powered by CComment