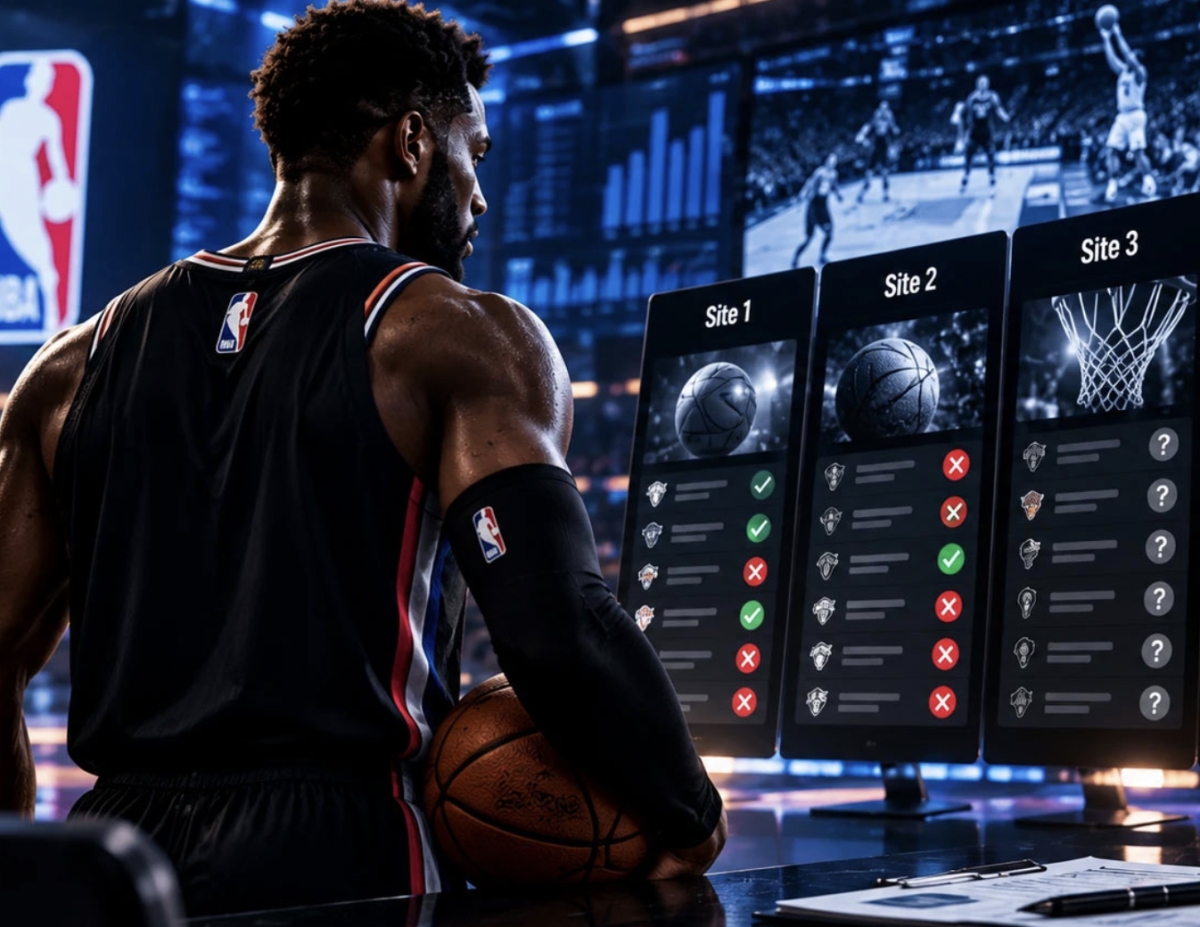
For anyone comparing NBA prediction sites, the most revealing page may not be the one showing today's best pick. It is the page showing yesterday's misses.
That became clear during a month-long editorial test of five services that publish NBA predictions, betting picks or model-driven forecasts. We followed what each site made available before games, checked whether selections remained identifiable after the final buzzer, and looked for a simple answer: could a reader reconstruct the service's record without relying on screenshots, promotional claims or a hand-picked list of winners?
The answer was surprisingly uneven.
Two of the five services offered the kind of public, loss-inclusive record that allows a reader to audit performance. The other three provided useful NBA analysis and predictions, but did not give us the same straightforward, pick-by-pick view of wins and losses for the predictions we were following. That distinction matters more than a glossy accuracy percentage.
The test was not designed to declare a single site the most accurate NBA predictor. A month is too short for that, particularly in a sport where injuries, rest, rotations and late line moves can change a game dramatically. The purpose was narrower: to examine how much evidence a normal reader gets after the prediction has been made.
The test was about accountability, not marketing
We deliberately avoided judging the services by how convincing their previews sounded. Almost every serious NBA prediction site can explain why a team should cover, why a total may go over or why a player prop looks attractive.
For the test, we looked at five different types of NBA prediction service. The group included established betting-analysis publishers, a computer-model driven prediction site, and newer services that explicitly promote public records. We did not treat all predictions as identical bets. A moneyline, a spread, a total and a player prop have different break-even points and different levels of volatility.
Instead, the central question was deliberately basic: after a prediction was published, could a reader later see what happened to that prediction?
Action Network, for example, publishes extensive NBA betting analysis and individual expert picks, and its game pages can show recent records for contributors. A June 2026 game page, for example, displayed both positive and negative 30-day records for individual experts. That is useful evidence, but it is not the same thing as a single, complete public ledger of every prediction made by the service.
Covers takes a similarly broad approach. Its NBA section combines expert picks, computer picks, odds, projections and analysis across markets including spreads, totals, moneylines and player props. The information is valuable for researching a game, but a reader looking for a simple, complete loss-inclusive record of every selection does not get the same experience as on a dedicated public track-record page.
Dimers is another example of a model-heavy prediction service. It publishes NBA moneyline, spread and total predictions, together with probabilities and projected scores, and explains that its models cover the NBA slate throughout the season. But the product is primarily presented around current predictions and matchup information rather than the kind of permanent, pick-by-pick public record used in our test.
None of that makes these services unreliable. It simply means that prediction quality and record transparency are two different questions.
What happened when we looked for the losses
The first service that clearly met our transparency test was Sport Insights.
Its NBA page does something refreshingly simple: it displays correct calls and missed calls side by side. At the time we checked the page, it showed 843 correct predictions and 522 missed predictions, for 1,365 NBA predictions and a stated accuracy of 61.8%. The site says it has been publishing predictions since 2024 and that the record updates automatically as fixtures settle. It also explicitly says results are published whether the prediction wins or loses.
The significance is not the 61.8% figure. A reader should be cautious about treating any historical hit rate as a forecast of future performance. The important part is that the denominator is visible. The service does not ask the reader to judge it from 20 highlighted winners; it shows that 522 calls missed as well.
That makes the number meaningful in a way that a collection of screenshots is not.
The second clear example was NBAPredictions.ai.
Its public track-record page is even more explicit about the principle. It says every pick is published before the game starts, graded from the final score and left on the record after the result. The page currently reports 2,586 graded picks, with 1,390 wins and 1,196 losses, and separately reports its higher-confidence “best bets” as 67 wins and 22 losses. It also provides the record as a downloadable spreadsheet.
There is an important detail here that is easy to overlook. The site itself warns that the record is still young, with 19 graded days in the current sample. That is the correct way to frame such data. A large number of predictions accumulated quickly does not automatically turn a short observation period into proof of a durable betting edge.
But from an accountability perspective, the mechanism is clear. If the model loses, the loss remains visible.
That is the standard the other services did not match in the same direct way during our test.
Why a visible loss is more valuable than a winning streak
The betting industry has a built-in presentation problem. A winner is easy to advertise. A losing pick is not.
A site can show a successful parlay, a correctly predicted spread or a player prop that landed comfortably. None of those examples tells a reader how many unsuccessful predictions surrounded it.
This is why the phrase “NBA predictions” can be misleadingly broad. A service may publish hundreds of projections but highlight only a small subset as its “best bets.” Another may publish every game but only promote the selections that later won. A third may change which market it considers the preferred bet as the odds move.
Those are not necessarily dishonest practices. But they make independent evaluation difficult.
A genuine record should answer several questions without requiring detective work. When was the prediction made? What exactly was the line or market? Was it a win, loss or push? How many previous selections are included? Are losing predictions still visible? And, where relevant, what odds were available when the prediction was published?
The more of those questions a site answers, the less the reader has to trust the marketing around the model.
Accuracy is not the same as profitability
This is where many comparisons of NBA prediction sites go wrong.
Suppose one model wins 60% of its picks and another wins 56%. It would be tempting to declare the first one better. But if the first model routinely recommends expensive favorites while the second finds plus-money prices, the simple win percentage does not tell the whole story.
At standard -110 odds, a bettor needs to win roughly 52.4% of wagers just to break even before considering other costs. That means a 55% record can be meaningful, while a 60% record can still be misleading if the quoted prices or methodology are unclear.
The same problem appears with player props. A model can have a high hit rate while offering little value if the market has already priced the probability correctly. Conversely, a lower hit rate can sometimes produce positive returns if the successful selections were available at sufficiently attractive odds.
This is why our test treated the public record as the starting point rather than the final verdict.
The question was not “Which website had the biggest number?”
It was “Which website gave the reader enough information to understand what that number actually represents?”
A prediction needs a timestamp
There is another weakness in many public pick feeds: timing.
A prediction made at 9 a.m. is not necessarily the same prediction at 6:45 p.m. NBA betting markets move when injury reports arrive, when a starting lineup changes and when large pieces of information enter the market.
For that reason, a transparent record should make it possible to establish when a pick existed.
This is one reason newer verification platforms have started emphasizing timestamped or locked predictions. BetEdge AI, for example, says its model picks are hashed before games and that results are subsequently graded and published, while Backt describes server-locked, timestamped predictions and public records containing wins, losses and voids. These systems illustrate where the wider prediction industry is heading: away from screenshots and toward records that are harder to rewrite after the event.
That does not mean a timestamp proves a real-money wager was placed. A prediction record and a sportsbook account are two different things. But a timestamp does establish a much more useful historical fact: the prediction existed before the result was known.
The difference between a forecast and a bet
Readers should also be careful with the word “pick.”
A site may predict that the Lakers have a 67% chance to win. That is a forecast.
A site may recommend Lakers -3.5 at -110. That is a betting selection.
A site may project 238 total points while the market is 232.5. That is a model signal that could lead to an Over bet.
These statements cannot be compared simply by counting wins.
A serious NBA prediction service should make the distinction visible. If the published line changes, the value of the selection can change with it. A spread at -2.5 and the same spread at -5 are not equivalent. A player prop at +105 and the same prop at -125 are not equivalent. A moneyline at +140 and +105 can have very different expected value even if the underlying team prediction is unchanged.
That is why a public record is strongest when it preserves the actual selection and, ideally, the price or line attached to it.
For readers comparing NBA best bets, this distinction is particularly important. The phrase sounds like a ranking of the strongest opportunities, but unless the site records which bets were actually designated as best bets before tip-off, it can become a label applied retrospectively to the winners.
What we learned from the month
Three services gave us substantial material to read: matchup analysis, projections, injury information, expert opinions or computer-generated probabilities. For a reader preparing for a particular slate, that information can be genuinely useful.
But useful analysis is not the same as an auditable history.
The two services that passed our stricter test made it possible to see losses without having to request them, reconstruct them from old articles or infer them from a changing percentage.
That difference becomes especially important after a bad week.
A model can have a losing Tuesday and still be a good model. NBA results contain plenty of randomness. A star can leave after five minutes, a team can shoot 15% from three, or a late injury can completely change the matchup. One losing night proves very little.
What matters is whether the losing night remains part of the record.
If it disappears, the reader cannot tell whether the model recovered because it is genuinely strong or because the unsuccessful selections were simply removed from view.
The strongest record is not necessarily the highest record
There is a temptation to turn this test into a leaderboard. We deliberately did not.
A public record with 1,000 selections and a 55% hit rate may deserve more confidence than a new model showing 80% after 20 picks. Sample size changes how much weight a statistic deserves.
The same applies to the 2,586-pick record currently displayed by NBAPredictions.ai. The volume makes the record easier to inspect, but the site's own warning about the short period is equally important. It is evidence of transparency, not proof that the model will outperform the market indefinitely.
Sport Insights provides a different kind of useful evidence because its NBA history stretches back further and its page explicitly shows both correct and missed calls. Again, the record should be judged on its methodology and market context, not on one percentage alone.
This distinction is worth making because transparency can itself become a marketing claim. Saying “we publish every loss” is only useful if readers can actually verify the underlying record.
The record needs to be accessible, understandable and consistent.
What readers should check before trusting an NBA model
The month-long test left us with a fairly simple checklist.
First, look for the full record rather than a highlights page. If only winning selections are easy to find, ask why.
Second, check whether predictions are posted before the game. A result cannot be used to validate a prediction if the timing is unclear.
Third, identify the market. Moneyline, spread, total and player prop results should not be thrown into one percentage without explanation.
Fourth, look for the line and odds. A pick without the price is often incomplete information.
Fifth, check whether pushes and voids are handled consistently. A model should not quietly exclude inconvenient outcomes.
Finally, consider sample size. Twenty wins from 25 picks is interesting. It is not the same evidence as hundreds or thousands of graded selections.
Transparency changes the conversation
There is a broader lesson here for the growing market of AI and data-driven sports prediction.
As models become easier to build, the prediction itself becomes less impressive. Anyone can publish a probability, a projected score or a confidence percentage. The difficult part is maintaining a public record after reality disagrees with the algorithm.
That is where prediction services should be competing.
Not only on how many winners they can display, but on how comfortably they can display the losers too.
The most credible model is not the one that never appears to be wrong. In NBA betting, that model does not exist. It is the one that lets the reader see exactly where it was wrong, how often, under what market conditions and over what sample.
Our five-site test therefore produced a result that was less glamorous than a conventional “best NBA predictions” ranking, but arguably more useful. Two services gave us a clear loss-inclusive record that could be checked after the games. Three offered substantial prediction and analysis content, but did not provide the same straightforward public accounting for the selections we monitored.
That does not prove that the two transparent services are better predictors.
It proves something narrower, and more important for anyone considering a prediction service: they gave the reader more evidence to work with.
In a market full of confident language, that may be the most valuable feature of all.
A prediction can be wrong. A model can have a bad month. Even a strong statistical process can suffer a losing streak.
What should not be difficult to find is the record.
If a site is willing to show you the wins, the losses, the timing and the sample behind them, you can make your own judgment. If it only shows you the winners, you are not really evaluating a track record. You are evaluating a marketing page.
Comments powered by CComment